|
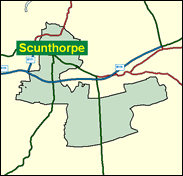
Scunthorpe
Labour hold

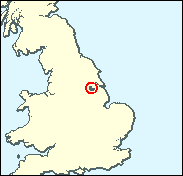
Few places outside the main metropolitan conurbations look so much the part of a Labour stronghold as Scunthorpe. The skyline here at the top of a once iron-rich scarp in north Lincolnshire is dominated by miles of giant steelworks. Despite some closures, it is still awesome to drive through or past them. It is also instructive to those interested in social geography to see the extensive working class estates built to accommodate the workforce. Amazingly, the seat including Scunthorpe was Conservative in 1979 and 1983, although it was never big enough to fill a seat of its own, and until 1997 it was hidden or semi-hidden in constituencies called Brigg, Brigg and Scunthorpe, and then Glanford and Scunthorpe. It still includes the staunchly separatist (and historically Tory) suburb of Bottesford, and a few villages around the wartime RAF Fighter Command sector HQ of Kirton in Lindsey; but the seat now proudly bears its own name alone, and now seems likely to elect Labour candidates alone for the foreseeable future.

Elliot Morley, a junior Agriculture Minister since 1997 and before then an agriculture spokesman for eight years, was first elected in 1987. A burly, ex-bearded, pink-cheeked former schoolteacher, born 1952 and educated at St Margaret's Church of England High School, Liverpool and Hull College of Education, he spent the Opposition years calling for bans to protect animal welfare (of hunted whales, foxes, mink and stags, of battery hens, tethered sows, and crated veal calves) and then in government had to justify foot-dragging in implementing bans, and dealing as fisheries minister with the further contraction of the UK industry at the behest of the Common Fisheries Policy. But he welcomes the EU's redefinition of animals as "sentient beings."
 |
| Wealthy Achievers, Suburban Areas |
6.42% |
14.99% |
42.83 |
|
| Affluent Greys, Rural Communities |
0.54% |
2.13% |
25.17 |
|
| Prosperous Pensioners, Retirement Areas |
0.29% |
2.49% |
11.78 |
|
| Affluent Executives, Family Areas |
0.68% |
4.43% |
15.46 |
|
| Well-Off Workers, Family Areas |
12.68% |
7.27% |
174.36 |
|
| Affluent Urbanites, Town & City Areas |
0.00% |
2.56% |
0.00 |
|
| Prosperous Professionals, Metropolitan Areas |
0.00% |
2.04% |
0.00 |
|
| Better-Off Executives, Inner City Areas |
0.55% |
3.94% |
13.83 |
|
| Comfortable Middle Agers, Mature Home Owning Areas |
18.61% |
13.04% |
142.76 |
|
| Skilled Workers, Home Owning Areas |
20.25% |
12.70% |
159.40 |
|
| New Home Owners, Mature Communities |
11.77% |
8.14% |
144.52 |
|
| White Collar Workers, Better-Off Multi Ethnic Areas |
0.54% |
4.02% |
13.31 |
|
| Older People, Less Prosperous Areas |
3.53% |
3.19% |
110.84 |
|
| Council Estate Residents, Better-Off Homes |
16.13% |
11.31% |
142.57 |
|
| Council Estate Residents, High Unemployment |
2.33% |
3.06% |
76.18 |
|
| Council Estate Residents, Greatest Hardship |
5.68% |
2.52% |
225.64 |
|
| People in Multi-Ethnic, Low-Income Areas |
0.00% |
2.10% |
0.00 |
|
| Unclassified |
0.00% |
0.06% |
0.00 |
|
|
 |
|
|
| £0-5K |
12.15% |
9.41% |
129.04 |
|
| £5-10K |
20.37% |
16.63% |
122.44 |
|
| £10-15K |
18.99% |
16.58% |
114.57 |
|
| £15-20K |
14.44% |
13.58% |
106.30 |
|
| £20-25K |
10.20% |
10.39% |
98.11 |
|
| £25-30K |
7.02% |
7.77% |
90.31 |
|
| £30-35K |
4.81% |
5.79% |
83.07 |
|
| £35-40K |
3.31% |
4.33% |
76.48 |
|
| £40-45K |
2.30% |
3.27% |
70.54 |
|
| £45-50K |
1.62% |
2.48% |
65.22 |
|
| £50-55K |
1.15% |
1.90% |
60.47 |
|
| £55-60K |
0.83% |
1.47% |
56.25 |
|
| £60-65K |
0.60% |
1.15% |
52.48 |
|
| £65-70K |
0.45% |
0.91% |
49.12 |
|
| £70-75K |
0.33% |
0.72% |
46.11 |
|
| £75-80K |
0.25% |
0.57% |
43.42 |
|
| £80-85K |
0.19% |
0.46% |
41.00 |
|
| £85-90K |
0.15% |
0.37% |
38.82 |
|
| £90-95K |
0.11% |
0.31% |
36.85 |
|
| £95-100K |
0.09% |
0.25% |
35.06 |
|
| £100K + |
0.37% |
1.34% |
27.25 |
|
|
|
|


|
1992-1997
|
1997-2001
|
|
|
|
| Con |
-9.60% |
| Lab |
6.09% |
| LD |
0.71% |
|
| Con |
2.62% |
| Lab |
-0.63% |
| LD |
0.97% |
|
|
|
Elliot Morley
Labour hold
|
| Con |
 |
9,724 |
28.92% |
| Lab |
 |
20,096 |
59.77% |
| LD |
 |
3,156 |
9.39% |
| Oth |
 |
649 |
1.93% |
| Maj |
 |
10,372 |
30.85% |
| Turn |
|
33,625 |
56.33% |
|
|
|
Elliot Morley
Labour hold
|
| UK |
John Cliff |
347 |
1.03% |
| L |
Elliot Morley |
20,096 |
59.77% |
| I |
David Patterson |
302 |
0.90% |
| C |
Bernard Theobald |
9,724 |
28.92% |
| LD |
Bob Tress |
3,156 |
9.39% |
|
Candidates representing 5 parties stood for election to this seat.
|
|
|
Elliot Morley
Labour
|
| Con |
|
10,934 |
26.30% |
| Lab |
|
25,107 |
60.39% |
| LD |
|
3,497 |
8.41% |
| Ref |
 |
1,637 |
3.94% |
| Oth |
|
399 |
0.96% |
| Maj |
|
14,173 |
34.09% |
| Turn |
|
41,574 |
68.84% |
|
|
|
|
Labour
|
| Con |
|
17,467 |
35.90% |
| Lab |
|
26,370 |
54.30% |
| LD |
|
3,727 |
7.70% |
| Oth |
|
1,035 |
2.10% |
| Maj |
|
8,903 |
18.30% |
| Turn |
|
48,599 |
78.05% |
|
|
|
|
|