|
Sedgefield
Labour hold

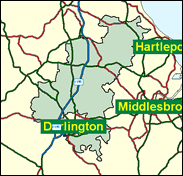
As Tony Blair looks like a hot favourite to become the first ever Labour Prime Minister to win two full terms of office, he is a racing certainty to win his fifth term as MP for Sedgefield. He could not be blamed if his mind wandered frequently onto the larger stage which he bestrides. He maintains a residence, Myrobella, in the community of Trimdon colliery, which is typical of the expanded ex-mining villages, with just about a century of Labour working class and trade union movement tradition as captured in the Durham Gala, such as Ferryhill. Different flavours are added by the country town of Sedgefield itself, with its racecourse and Shrove Tuesday football match, and the largest centre of population, the New Town of Newton Aycliffe. Somehow County Durham seems the wrong sort of base for Tony Blair, with his classless goals and lack of roots in the Labour tradition; but he is surely grateful for a generous and tolerant constituency.

Tony Blair, elected here in 1983, achieved in 1997 Labour's biggest ever landslide of 418 seats, by taking the Party into the Conservative southern heartlands. Born in 1953 into a Conservative-voting family and educated at Fettes and St John's College, Oxford - where he was apolitical - he rose in Labour politics in his 20s as an employment law barrister, and as a frontbencher coined an eye-catching sound-bite, "tough on crime, tough on the causes of crime", simultaneously reassuring to Guardian and to Mail readers. If Labour's 1997 victory was based largely on a rejection of the Conservatives and on perceptions of a Labour Party sanitised mostly under Smith and Kinnock, it also owed something to Blair's classless appeal to middle England in contrast to his predecessors' limited regional personas. With no 'big idea' emerging to clinch the second term denied Attlee and Wilson, reliance is placed on perceptions of Labour's economic competence, and of a Conservative Party still stuck with the image that sunk it in 1997, salted by a dose of focus-group-driven populism and a hope, no doubt, that the foot and mouth epidemic somehow reaches the hecklers from the WI.
 |
| Wealthy Achievers, Suburban Areas |
12.01% |
14.99% |
80.09 |
|
| Affluent Greys, Rural Communities |
0.31% |
2.13% |
14.52 |
|
| Prosperous Pensioners, Retirement Areas |
0.05% |
2.49% |
2.05 |
|
| Affluent Executives, Family Areas |
4.93% |
4.43% |
111.45 |
|
| Well-Off Workers, Family Areas |
10.19% |
7.27% |
140.10 |
|
| Affluent Urbanites, Town & City Areas |
0.00% |
2.56% |
0.00 |
|
| Prosperous Professionals, Metropolitan Areas |
0.00% |
2.04% |
0.00 |
|
| Better-Off Executives, Inner City Areas |
0.33% |
3.94% |
8.37 |
|
| Comfortable Middle Agers, Mature Home Owning Areas |
6.04% |
13.04% |
46.29 |
|
| Skilled Workers, Home Owning Areas |
19.91% |
12.70% |
156.73 |
|
| New Home Owners, Mature Communities |
20.91% |
8.14% |
256.77 |
|
| White Collar Workers, Better-Off Multi Ethnic Areas |
0.00% |
4.02% |
0.00 |
|
| Older People, Less Prosperous Areas |
1.82% |
3.19% |
57.29 |
|
| Council Estate Residents, Better-Off Homes |
18.72% |
11.31% |
165.51 |
|
| Council Estate Residents, High Unemployment |
0.00% |
3.06% |
0.00 |
|
| Council Estate Residents, Greatest Hardship |
4.57% |
2.52% |
181.54 |
|
| People in Multi-Ethnic, Low-Income Areas |
0.00% |
2.10% |
0.00 |
|
| Unclassified |
0.21% |
0.06% |
333.28 |
|
|
 |
 |
 |
| £0-5K |
11.51% |
9.41% |
122.30 |
|
| £5-10K |
19.82% |
16.63% |
119.16 |
|
| £10-15K |
18.23% |
16.58% |
109.97 |
|
| £15-20K |
13.79% |
13.58% |
101.49 |
|
| £20-25K |
9.84% |
10.39% |
94.69 |
|
| £25-30K |
6.95% |
7.77% |
89.40 |
|
| £30-35K |
4.94% |
5.79% |
85.27 |
|
| £35-40K |
3.55% |
4.33% |
81.98 |
|
| £40-45K |
2.59% |
3.27% |
79.31 |
|
| £45-50K |
1.91% |
2.48% |
77.09 |
|
| £50-55K |
1.43% |
1.90% |
75.19 |
|
| £55-60K |
1.08% |
1.47% |
73.54 |
|
| £60-65K |
0.83% |
1.15% |
72.08 |
|
| £65-70K |
0.64% |
0.91% |
70.77 |
|
| £70-75K |
0.50% |
0.72% |
69.57 |
|
| £75-80K |
0.39% |
0.57% |
68.47 |
|
| £80-85K |
0.31% |
0.46% |
67.45 |
|
| £85-90K |
0.25% |
0.37% |
66.48 |
|
| £90-95K |
0.20% |
0.31% |
65.58 |
|
| £95-100K |
0.16% |
0.25% |
64.72 |
|
| £100K + |
0.80% |
1.34% |
59.87 |
|
|
|

|


|
1992-1997
|
1997-2001
|
|
|
|
| Con |
-10.31% |
| Lab |
8.96% |
| LD |
-3.23% |
|
| Con |
3.07% |
| Lab |
-6.30% |
| LD |
2.53% |
|
|
 |
Tony Blair
Labour hold
|
| Con |
 |
8,397 |
20.86% |
| Lab |
 |
26,110 |
64.86% |
| LD |
 |
3,624 |
9.00% |
| Oth |
 |
2,127 |
5.28% |
| Maj |
 |
17,713 |
44.00% |
| Turn |
 |
40,258 |
62.01% |
|
|
 |
Tony Blair
Labour hold
|
| L |
Tony Blair |
26,110 |
64.86% |
| C |
Douglas Carswell |
8,397 |
20.86% |
| RRL |
Christopher Driver |
375 |
0.93% |
| LD |
Andrew Duffield |
3,624 |
9.00% |
| SL |
Brian Gibson |
518 |
1.29% |
| WFLOE |
Helen John |
260 |
0.65% |
| UK |
Andrew Spence |
974 |
2.42% |
|
Candidates representing 7 parties stood for election to this seat.
|
|
 |
Tony Blair
Labour
|
| Con |
 |
8,383 |
17.79% |
| Lab |
 |
33,526 |
71.16% |
| LD |
 |
3,050 |
6.47% |
| Ref |
 |
1,683 |
3.57% |
| Oth |
 |
474 |
1.01% |
| Maj |
 |
25,143 |
53.36% |
| Turn |
 |
47,116 |
72.57% |
|
|
 |
|
Labour
|
| Con |
 |
14,161 |
28.10% |
| Lab |
 |
31,391 |
62.20% |
| LD |
 |
4,897 |
9.70% |
| Oth |
|
0 |
0.00% |
| Maj |
 |
17,230 |
34.20% |
| Turn |
 |
50,449 |
76.27% |
|
|
 |
|

|

