|
Selby
Labour hold

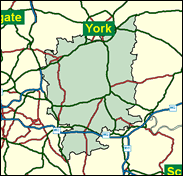
Several of the very best Conservative chances of a recapture are to be found in the huge county of Yorkshire. John Grogan needed an 11pc swing to take Selby in 1997, and then only by a margin of under 4,000, making it their 40th most narrow win. Yet there is hope for Labour. In the Selby district elections of May 1999, they still returned 20 councillors to the Tories' 15, and received 41pc of the total vote compared with 33pc. Not only did they win wards in the small towns such as Selby itself and Sherburn-in-Elmet, but this is the site of the last coalfield to be developed in England, and maybe the last to close, so Labour also does very well in apparently rural wards with splendidly rustic names like Barlby with Osgodby, Riccall with Kelfield, and Byram cum Sutton. This is not in fact a conventional agricultural seat and may elect Labour, and Grogan, again. But there are still more people employed in farming than in all but two other Labour 1997 seats (Norfolk NW and Brigg/Goole) and it will be an uphill fight, if such a term is appropriate in this flat terrain.

John Grogan, third-time-lucky in the same seat in 1997, is Yorkshire-born (1961) of Irish origins, educated at St Michael's (RC) College, Leeds and St John's College, Oxford, where he ran the Students' (not to be confused with the Oxford) Union and then worked as a Labour Party staffer, mostly with Leeds City Council. He operates as a locally-focused MP, with threatened brewing, coal and farming interests to defend, and as if that were not enough, in February this year, a train crash named after his constituency. Conservative hopes here rest with Michael Mitchell, an accountant (with Storehouse PLC - Habitat, BHS & Mothercare)-turned-academic bookseller. He was born in 1959 and educated at Wells Cathedral School and Trinity College Cambridge, He fought Greenwich & Woolwich in 1997.
 |
| Wealthy Achievers, Suburban Areas |
26.64% |
14.99% |
177.70 |
|
| Affluent Greys, Rural Communities |
1.08% |
2.13% |
50.90 |
|
| Prosperous Pensioners, Retirement Areas |
0.21% |
2.49% |
8.57 |
|
| Affluent Executives, Family Areas |
10.38% |
4.43% |
234.67 |
|
| Well-Off Workers, Family Areas |
14.63% |
7.27% |
201.19 |
|
| Affluent Urbanites, Town & City Areas |
0.28% |
2.56% |
11.04 |
|
| Prosperous Professionals, Metropolitan Areas |
0.00% |
2.04% |
0.00 |
|
| Better-Off Executives, Inner City Areas |
0.96% |
3.94% |
24.31 |
|
| Comfortable Middle Agers, Mature Home Owning Areas |
17.90% |
13.04% |
137.30 |
|
| Skilled Workers, Home Owning Areas |
10.36% |
12.70% |
81.53 |
|
| New Home Owners, Mature Communities |
8.43% |
8.14% |
103.56 |
|
| White Collar Workers, Better-Off Multi Ethnic Areas |
0.58% |
4.02% |
14.46 |
|
| Older People, Less Prosperous Areas |
2.22% |
3.19% |
69.73 |
|
| Council Estate Residents, Better-Off Homes |
5.10% |
11.31% |
45.12 |
|
| Council Estate Residents, High Unemployment |
0.04% |
3.06% |
1.25 |
|
| Council Estate Residents, Greatest Hardship |
1.10% |
2.52% |
43.49 |
|
| People in Multi-Ethnic, Low-Income Areas |
0.00% |
2.10% |
0.00 |
|
| Unclassified |
0.07% |
0.06% |
110.47 |
|
|
 |
 |
 |
| £0-5K |
6.81% |
9.41% |
72.36 |
|
| £5-10K |
14.13% |
16.63% |
84.92 |
|
| £10-15K |
15.75% |
16.58% |
95.02 |
|
| £15-20K |
13.93% |
13.58% |
102.55 |
|
| £20-25K |
11.22% |
10.39% |
107.95 |
|
| £25-30K |
8.68% |
7.77% |
111.71 |
|
| £30-35K |
6.62% |
5.79% |
114.24 |
|
| £35-40K |
5.02% |
4.33% |
115.87 |
|
| £40-45K |
3.81% |
3.27% |
116.84 |
|
| £45-50K |
2.91% |
2.48% |
117.34 |
|
| £50-55K |
2.24% |
1.90% |
117.51 |
|
| £55-60K |
1.73% |
1.47% |
117.44 |
|
| £60-65K |
1.35% |
1.15% |
117.21 |
|
| £65-70K |
1.06% |
0.91% |
116.87 |
|
| £70-75K |
0.84% |
0.72% |
116.46 |
|
| £75-80K |
0.67% |
0.57% |
116.00 |
|
| £80-85K |
0.53% |
0.46% |
115.51 |
|
| £85-90K |
0.43% |
0.37% |
115.02 |
|
| £90-95K |
0.35% |
0.31% |
114.53 |
|
| £95-100K |
0.29% |
0.25% |
114.05 |
|
| £100K + |
1.50% |
1.34% |
111.67 |
|
|
|

|


|
1992-1997
|
1997-2001
|
|
|
|
| Con |
-12.13% |
| Lab |
10.18% |
| LD |
-1.06% |
|
| Con |
1.74% |
| Lab |
-0.82% |
| LD |
-0.96% |
|
|
 |
John Grogan
Labour hold
|
| Con |
 |
20,514 |
40.81% |
| Lab |
 |
22,652 |
45.06% |
| LD |
 |
5,569 |
11.08% |
| Oth |
 |
1,537 |
3.06% |
| Maj |
 |
2,138 |
4.25% |
| Turn |
 |
50,272 |
64.51% |
|
|
 |
John Grogan
Labour hold
|
| L |
John Grogan |
22,652 |
45.06% |
| G |
Helen Kenwright |
902 |
1.79% |
| UK |
Bob Lewis |
635 |
1.26% |
| C |
Michael Mitchell |
20,514 |
40.81% |
| LD |
Jeremy Wilcock |
5,569 |
11.08% |
|
Candidates representing 5 parties stood for election to this seat.
|
|
 |
John Grogan
Labour gain
|
| Con |
 |
22,002 |
39.07% |
| Lab |
 |
25,838 |
45.88% |
| LD |
 |
6,778 |
12.04% |
| Ref |
 |
1,162 |
2.06% |
| Oth |
 |
536 |
0.95% |
| Maj |
 |
3,836 |
6.81% |
| Turn |
 |
56,316 |
74.95% |
|
|
 |
|
Conservative
|
| Con |
 |
29,739 |
51.20% |
| Lab |
 |
20,752 |
35.70% |
| LD |
 |
7,595 |
13.10% |
| Oth |
|
0 |
0.00% |
| Maj |
 |
8,987 |
15.50% |
| Turn |
 |
58,086 |
80.50% |
|
|
 |
|

|

