|
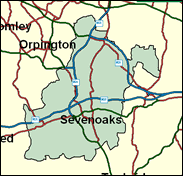
Sevenoaks
Conservative hold

West Kent is socially and politically similar to that most Tory of counties Surrey, just over the border near Winston Churchill's Chartwell home outside Westerham, rather than the more plebeian Thames frontage or south east coast, and it is no surprise that Sevenoaks was the safest Conservative constituency in Kent in 1997 (just, from Tonbridge and Malling). This outcome was helped by the almost exactly even division of the non-Tory vote between Labour and the Liberal Democrats, who each also won 9 seats on the Sevenoaks council in its last all out elections in 1999 - to the Tories' 33.

Michael Fallon, a rising hard-right Thatcherite Education Minister until he lost his seat at Darlington in 1992, was elected here in 1997, brought back onto the front bench by William Hague as a DTI, then Treasury, spokesman, but was dropped in 1999. A doctor's son, born 1952, he was educated at Epsom College and St Andrew's University, famous for its 'Mafia' gathered at the feet of the free market economist, Dr Madsen Pirie. Co-author of the 1985 'No Turning Back' manifesto calling for the sell-off of the NHS and schools, he combines a theological espousal of the market with a frosty unclubbable manner, which could well ensure that, despite nine earlier years spent as a party staffer, he spends more time with his consultancies on the back benches.
 |
| Wealthy Achievers, Suburban Areas |
37.75% |
14.99% |
251.80 |
|
| Affluent Greys, Rural Communities |
0.30% |
2.13% |
14.23 |
|
| Prosperous Pensioners, Retirement Areas |
1.23% |
2.49% |
49.34 |
|
| Affluent Executives, Family Areas |
2.07% |
4.43% |
46.69 |
|
| Well-Off Workers, Family Areas |
10.95% |
7.27% |
150.51 |
|
| Affluent Urbanites, Town & City Areas |
5.21% |
2.56% |
203.14 |
|
| Prosperous Professionals, Metropolitan Areas |
2.02% |
2.04% |
98.88 |
|
| Better-Off Executives, Inner City Areas |
0.39% |
3.94% |
9.96 |
|
| Comfortable Middle Agers, Mature Home Owning Areas |
20.17% |
13.04% |
154.69 |
|
| Skilled Workers, Home Owning Areas |
6.92% |
12.70% |
54.51 |
|
| New Home Owners, Mature Communities |
4.91% |
8.14% |
60.29 |
|
| White Collar Workers, Better-Off Multi Ethnic Areas |
0.73% |
4.02% |
18.13 |
|
| Older People, Less Prosperous Areas |
1.39% |
3.19% |
43.73 |
|
| Council Estate Residents, Better-Off Homes |
5.95% |
11.31% |
52.60 |
|
| Council Estate Residents, High Unemployment |
0.00% |
3.06% |
0.07 |
|
| Council Estate Residents, Greatest Hardship |
0.00% |
2.52% |
0.00 |
|
| People in Multi-Ethnic, Low-Income Areas |
0.00% |
2.10% |
0.00 |
|
| Unclassified |
0.00% |
0.06% |
7.16 |
|
|
 |
 |
 |
| £0-5K |
5.65% |
9.41% |
59.98 |
|
| £5-10K |
10.86% |
16.63% |
65.26 |
|
| £10-15K |
12.58% |
16.58% |
75.88 |
|
| £15-20K |
11.93% |
13.58% |
87.85 |
|
| £20-25K |
10.39% |
10.39% |
100.00 |
|
| £25-30K |
8.70% |
7.77% |
111.86 |
|
| £30-35K |
7.14% |
5.79% |
123.22 |
|
| £35-40K |
5.81% |
4.33% |
134.00 |
|
| £40-45K |
4.71% |
3.27% |
144.19 |
|
| £45-50K |
3.82% |
2.48% |
153.80 |
|
| £50-55K |
3.10% |
1.90% |
162.85 |
|
| £55-60K |
2.53% |
1.47% |
171.37 |
|
| £60-65K |
2.07% |
1.15% |
179.42 |
|
| £65-70K |
1.70% |
0.91% |
187.02 |
|
| £70-75K |
1.40% |
0.72% |
194.22 |
|
| £75-80K |
1.16% |
0.57% |
201.03 |
|
| £80-85K |
0.96% |
0.46% |
207.50 |
|
| £85-90K |
0.80% |
0.37% |
213.65 |
|
| £90-95K |
0.67% |
0.31% |
219.50 |
|
| £95-100K |
0.56% |
0.25% |
225.08 |
|
| £100K + |
3.44% |
1.34% |
255.95 |
|
|
|

|


|
1992-1997
|
1997-2001
|
|
|
|
| Con |
-12.18% |
| Lab |
8.46% |
| LD |
-0.50% |
|
| Con |
3.98% |
| Lab |
1.02% |
| LD |
-2.48% |
|
|
 |
Michael Fallon
Conservative hold
|
| Con |
 |
21,052 |
49.40% |
| Lab |
 |
10,898 |
25.57% |
| LD |
 |
9,214 |
21.62% |
| Oth |
 |
1,450 |
3.40% |
| Maj |
 |
10,154 |
23.83% |
| Turn |
 |
42,614 |
63.94% |
|
|
 |
Michael Fallon
Conservative hold
|
| PF |
Mark Ellis |
295 |
0.69% |
| C |
Michael Fallon |
21,052 |
49.40% |
| LD |
Clive Gray |
9,214 |
21.62% |
| UK |
Lisa Hawkins |
1,155 |
2.71% |
| L |
Caroline Humphreys |
10,898 |
25.57% |
|
Candidates representing 5 parties stood for election to this seat.
|
|
 |
Michael Fallon
Conservative
|
| Con |
 |
22,776 |
45.42% |
| Lab |
 |
12,315 |
24.56% |
| LD |
 |
12,086 |
24.10% |
| Ref |
 |
2,138 |
4.26% |
| Oth |
 |
834 |
1.66% |
| Maj |
 |
10,461 |
20.86% |
| Turn |
 |
50,149 |
75.44% |
|
|
 |
|
Conservative
|
| Con |
 |
30,847 |
57.60% |
| Lab |
 |
8,626 |
16.10% |
| LD |
 |
13,160 |
24.60% |
| Oth |
 |
887 |
1.70% |
| Maj |
 |
17,687 |
33.00% |
| Turn |
 |
53,520 |
80.23% |
|
|
 |
|

|

