|
Sheffield, Attercliffe
Labour hold

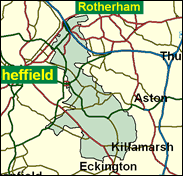
The Liberal Democrats have not only seized most middle-class former Conservative wards of Sheffield along with the Hallam constituency, but have in very recent years extended their attentions and incursions to working class Labour areas. However, so far success, even at city council level, has been confined to the Heeley and Hillsborough wards, leaving the Attercliffe sub-divisions of Birley, Darnall, Handsworth and Mosborough in the south eastern quadrant of Sheffield in Labour hands for the time being. There is therefore only the most distant threat as yet to Clive Betts's role as MP here.

Clive Betts, elected here in 1992, would appear to be a man of underfulfilled promise as a big city (Sheffield) council leader lost in the drudgery of the Whips Office rather than pursuing a high-profile ministerial career (as enjoyed by other former council bosses such as Blunkett and Hodge), perhaps because he was a Tory target as a high spender when running Sheffield. Born 1950 and educated at King Edward VII School, Sheffield, and Pembroke College Cambridge, he was a local government economist before running Sheffield City Council for five years following Blunkett's reign, and is approved by those who vaunt his Sheffield-promoted "New Realism" of public-private partnerships. Gargoyle-featured and uncharismatic, as a backbencher he predictably focused on local government finance, but now demonstrates the virtues of local council chamber discipline transposed to managing the PLP. He was responsible for whipping the minimum wage Bill
 |
| Wealthy Achievers, Suburban Areas |
3.71% |
14.99% |
24.74 |
|
| Affluent Greys, Rural Communities |
0.00% |
2.13% |
0.00 |
|
| Prosperous Pensioners, Retirement Areas |
0.00% |
2.49% |
0.00 |
|
| Affluent Executives, Family Areas |
5.53% |
4.43% |
124.86 |
|
| Well-Off Workers, Family Areas |
9.33% |
7.27% |
128.24 |
|
| Affluent Urbanites, Town & City Areas |
0.06% |
2.56% |
2.41 |
|
| Prosperous Professionals, Metropolitan Areas |
0.00% |
2.04% |
0.00 |
|
| Better-Off Executives, Inner City Areas |
0.00% |
3.94% |
0.00 |
|
| Comfortable Middle Agers, Mature Home Owning Areas |
8.14% |
13.04% |
62.42 |
|
| Skilled Workers, Home Owning Areas |
18.41% |
12.70% |
144.95 |
|
| New Home Owners, Mature Communities |
25.57% |
8.14% |
314.01 |
|
| White Collar Workers, Better-Off Multi Ethnic Areas |
0.00% |
4.02% |
0.00 |
|
| Older People, Less Prosperous Areas |
11.04% |
3.19% |
346.57 |
|
| Council Estate Residents, Better-Off Homes |
11.11% |
11.31% |
98.18 |
|
| Council Estate Residents, High Unemployment |
3.62% |
3.06% |
118.21 |
|
| Council Estate Residents, Greatest Hardship |
2.45% |
2.52% |
97.19 |
|
| People in Multi-Ethnic, Low-Income Areas |
1.04% |
2.10% |
49.56 |
|
| Unclassified |
0.00% |
0.06% |
0.00 |
|
|
 |
 |
 |
| £0-5K |
12.87% |
9.41% |
136.73 |
|
| £5-10K |
21.30% |
16.63% |
128.05 |
|
| £10-15K |
19.28% |
16.58% |
116.31 |
|
| £15-20K |
14.29% |
13.58% |
105.24 |
|
| £20-25K |
9.90% |
10.39% |
95.26 |
|
| £25-30K |
6.72% |
7.77% |
86.39 |
|
| £30-35K |
4.55% |
5.79% |
78.58 |
|
| £35-40K |
3.11% |
4.33% |
71.74 |
|
| £40-45K |
2.15% |
3.27% |
65.75 |
|
| £45-50K |
1.50% |
2.48% |
60.52 |
|
| £50-55K |
1.07% |
1.90% |
55.95 |
|
| £55-60K |
0.77% |
1.47% |
51.93 |
|
| £60-65K |
0.56% |
1.15% |
48.39 |
|
| £65-70K |
0.41% |
0.91% |
45.26 |
|
| £70-75K |
0.31% |
0.72% |
42.47 |
|
| £75-80K |
0.23% |
0.57% |
39.99 |
|
| £80-85K |
0.17% |
0.46% |
37.76 |
|
| £85-90K |
0.13% |
0.37% |
35.75 |
|
| £90-95K |
0.10% |
0.31% |
33.93 |
|
| £95-100K |
0.08% |
0.25% |
32.27 |
|
| £100K + |
0.33% |
1.34% |
24.89 |
|
|
|

|


|
1992-1997
|
1997-2001
|
|
|
|
| Con |
-10.24% |
| Lab |
7.79% |
| LD |
1.03% |
|
| Con |
-0.87% |
| Lab |
2.50% |
| LD |
-1.52% |
|
|
 |
Clive Betts
Labour hold
|
| Con |
 |
5,443 |
15.19% |
| Lab |
 |
24,287 |
67.80% |
| LD |
 |
5,092 |
14.21% |
| Oth |
 |
1,002 |
2.80% |
| Maj |
 |
18,844 |
52.60% |
| Turn |
 |
35,824 |
52.38% |
|
|
 |
Clive Betts
Labour hold
|
| UK |
Pauline Arnott |
1,002 |
2.80% |
| L |
Clive Betts |
24,287 |
67.80% |
| C |
John Perry |
5,443 |
15.19% |
| LD |
Gail Smith |
5,092 |
14.21% |
|
Candidates representing 4 parties stood for election to this seat.
|
|
 |
Clive Betts
Labour
|
| Con |
 |
7,119 |
16.06% |
| Lab |
 |
28,937 |
65.29% |
| LD |
 |
6,973 |
15.73% |
| Ref |
 |
1,289 |
2.91% |
| Oth |
|
0 |
0.00% |
| Maj |
 |
21,818 |
49.23% |
| Turn |
 |
44,318 |
64.65% |
|
|
 |
|
Labour
|
| Con |
 |
13,083 |
26.30% |
| Lab |
 |
28,563 |
57.50% |
| LD |
 |
7,283 |
14.70% |
| Oth |
 |
751 |
1.50% |
| Maj |
 |
15,480 |
31.20% |
| Turn |
 |
49,680 |
71.27% |
|
|
 |
|

|

