|
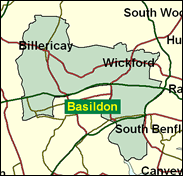
Billericay
Conservative hold

Teresa Gorman is retiring after 13 eventful years as MP for Billericay, and should be able to bequeath an increased majority to her successor, John Baron, who lost at Basildon last time. In 1997 she won by her narrowest margin, just 1,356 votes, but that was after a massive swing to Labour of nearly 17.5pc. This is still basic Tory territory though, with a distinctly different political history from that of the sprawling New Town just to the south, and Mr Baron will probably not suffer for being a less colourful and high profile candidate. It really should not be tricky for a Tory MP to hail from Billericay.

With the retirement of HRT-assisted Teresa Gorman, the Conservatives are fielding John Baron, a Rothschilds banker and former Army officer with four years' experience of postings in Ulster, Cyprus and Germany. Born 1959, educated at Queens College, Taunton and Jesus College Cambridge, he lost Basildon to Labour in 1997. Labour's Amanda Campbell is in PR, was born in 1963, and is a London Borough councillor.
 |
| Wealthy Achievers, Suburban Areas |
26.83% |
14.99% |
178.94 |
|
| Affluent Greys, Rural Communities |
0.00% |
2.13% |
0.00 |
|
| Prosperous Pensioners, Retirement Areas |
1.36% |
2.49% |
54.57 |
|
| Affluent Executives, Family Areas |
11.76% |
4.43% |
265.87 |
|
| Well-Off Workers, Family Areas |
11.75% |
7.27% |
161.55 |
|
| Affluent Urbanites, Town & City Areas |
2.11% |
2.56% |
82.24 |
|
| Prosperous Professionals, Metropolitan Areas |
0.22% |
2.04% |
10.76 |
|
| Better-Off Executives, Inner City Areas |
0.00% |
3.94% |
0.00 |
|
| Comfortable Middle Agers, Mature Home Owning Areas |
14.98% |
13.04% |
114.85 |
|
| Skilled Workers, Home Owning Areas |
3.27% |
12.70% |
25.72 |
|
| New Home Owners, Mature Communities |
4.03% |
8.14% |
49.48 |
|
| White Collar Workers, Better-Off Multi Ethnic Areas |
0.17% |
4.02% |
4.25 |
|
| Older People, Less Prosperous Areas |
5.27% |
3.19% |
165.40 |
|
| Council Estate Residents, Better-Off Homes |
15.48% |
11.31% |
136.85 |
|
| Council Estate Residents, High Unemployment |
0.99% |
3.06% |
32.47 |
|
| Council Estate Residents, Greatest Hardship |
1.79% |
2.52% |
70.89 |
|
| People in Multi-Ethnic, Low-Income Areas |
0.00% |
2.10% |
0.00 |
|
| Unclassified |
0.00% |
0.06% |
0.00 |
|
|
 |
|
|
| £0-5K |
6.42% |
9.41% |
68.25 |
|
| £5-10K |
12.10% |
16.63% |
72.74 |
|
| £10-15K |
13.57% |
16.58% |
81.87 |
|
| £15-20K |
12.52% |
13.58% |
92.15 |
|
| £20-25K |
10.64% |
10.39% |
102.34 |
|
| £25-30K |
8.70% |
7.77% |
111.92 |
|
| £30-35K |
6.99% |
5.79% |
120.68 |
|
| £35-40K |
5.57% |
4.33% |
128.56 |
|
| £40-45K |
4.43% |
3.27% |
135.60 |
|
| £45-50K |
3.52% |
2.48% |
141.83 |
|
| £50-55K |
2.81% |
1.90% |
147.34 |
|
| £55-60K |
2.24% |
1.47% |
152.20 |
|
| £60-65K |
1.80% |
1.15% |
156.47 |
|
| £65-70K |
1.45% |
0.91% |
160.23 |
|
| £70-75K |
1.18% |
0.72% |
163.53 |
|
| £75-80K |
0.96% |
0.57% |
166.43 |
|
| £80-85K |
0.78% |
0.46% |
168.98 |
|
| £85-90K |
0.64% |
0.37% |
171.21 |
|
| £90-95K |
0.53% |
0.31% |
173.16 |
|
| £95-100K |
0.44% |
0.25% |
174.87 |
|
| £100K + |
2.42% |
1.34% |
180.18 |
|
|
|
|


|
1992-1997
|
1997-2001
|
|
|
|
| Con |
-17.84% |
| Lab |
17.31% |
| LD |
-6.49% |
|
| Con |
7.63% |
| Lab |
-0.92% |
| LD |
-1.95% |
|
|
|
John Baron
Conservative hold
|
| Con |
 |
21,608 |
47.39% |
| Lab |
 |
16,595 |
36.39% |
| LD |
 |
6,323 |
13.87% |
| Oth |
 |
1,072 |
2.35% |
| Maj |
 |
5,013 |
10.99% |
| Turn |
|
45,598 |
58.07% |
|
|
|
John Baron
Conservative hold
|
| C |
John Baron |
21,608 |
47.39% |
| LD |
Frank Bellard |
6,323 |
13.87% |
| L |
Amanda Campbell |
16,595 |
36.39% |
| UK |
Nick Yeomans |
1,072 |
2.35% |
|
Candidates representing 4 parties stood for election to this seat.
|
|
|
Teresa Gorman
Conservative
|
| Con |
|
22,033 |
39.76% |
| Lab |
|
20,677 |
37.31% |
| LD |
|
8,763 |
15.81% |
| Ref |
|
0 |
0.00% |
| Oth |
|
3,947 |
7.12% |
| Maj |
|
1,356 |
2.45% |
| Turn |
|
55,420 |
72.40% |
|
|
|
|
Conservative
|
| Con |
|
34,274 |
57.60% |
| Lab |
|
11,914 |
20.00% |
| LD |
|
13,276 |
22.30% |
| Oth |
|
0 |
0.00% |
| Maj |
|
20,998 |
35.30% |
| Turn |
|
59,464 |
80.75% |
|
|
|
|
|