|
Sheffield, Brightside
Labour hold

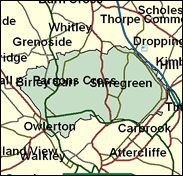
The Liberal Democrats have not only seized most middle-class former Conservative wards of Sheffield along with the Hallam constituency, but have in very recent years extended their attentions and incursions to working class Labour areas. However, so far success, even at city council level, has been confined to the wards within the Heeley and Hillsborough constiutuencies, leaving the Brightside wards in Labour hands for the time being. There is therefore only the most distant threat as yet to David Blunkett's role as MP here, which is as well, as he is tipped for even higher office should Labour be returned for a second consecutive full term as expected.

David Blunkett, only the third blind MP and the first blind Cabinet Minister, was first elected here in 1987 after seven years running Sheffield Council, to which he was elected at the age of 22. Born blind in 1947 and educated at blind schools and, eventually, at Sheffield University, he taught for 13 years at Barnsley College of Technology. Resistantly-bearded, he was elected, as the first non-MP since Harold Laski, to the constituency section of Labour's NEC in 1983, and proceeded to weave a middle way between the hard left and the Militant-baiters. As Education spokesman since 1994 - and Secretary of State since 1997, he has also manoeuvred through the PC orthodoxies of the teachers' unions and the grade A gobbledegook of the educational establishment, and routinely employed the verb 'to deliver' as if education is something tipped off the back of a truck. With a history of resistance to a lowered homosexual age of consent, he was by 2001 voting politically-correctly in favour.
 |
| Wealthy Achievers, Suburban Areas |
0.00% |
14.99% |
0.00 |
|
| Affluent Greys, Rural Communities |
0.00% |
2.13% |
0.00 |
|
| Prosperous Pensioners, Retirement Areas |
0.00% |
2.49% |
0.00 |
|
| Affluent Executives, Family Areas |
0.00% |
4.43% |
0.00 |
|
| Well-Off Workers, Family Areas |
7.80% |
7.27% |
107.27 |
|
| Affluent Urbanites, Town & City Areas |
0.43% |
2.56% |
16.73 |
|
| Prosperous Professionals, Metropolitan Areas |
0.00% |
2.04% |
0.00 |
|
| Better-Off Executives, Inner City Areas |
0.24% |
3.94% |
6.08 |
|
| Comfortable Middle Agers, Mature Home Owning Areas |
0.80% |
13.04% |
6.12 |
|
| Skilled Workers, Home Owning Areas |
13.39% |
12.70% |
105.41 |
|
| New Home Owners, Mature Communities |
11.45% |
8.14% |
140.57 |
|
| White Collar Workers, Better-Off Multi Ethnic Areas |
0.00% |
4.02% |
0.00 |
|
| Older People, Less Prosperous Areas |
6.41% |
3.19% |
201.30 |
|
| Council Estate Residents, Better-Off Homes |
46.31% |
11.31% |
409.39 |
|
| Council Estate Residents, High Unemployment |
3.08% |
3.06% |
100.45 |
|
| Council Estate Residents, Greatest Hardship |
8.86% |
2.52% |
351.89 |
|
| People in Multi-Ethnic, Low-Income Areas |
1.24% |
2.10% |
58.89 |
|
| Unclassified |
0.00% |
0.06% |
1.97 |
|
|
 |
 |
 |
| £0-5K |
17.92% |
9.41% |
190.38 |
|
| £5-10K |
26.40% |
16.63% |
158.73 |
|
| £10-15K |
20.88% |
16.58% |
125.94 |
|
| £15-20K |
13.53% |
13.58% |
99.61 |
|
| £20-25K |
8.23% |
10.39% |
79.20 |
|
| £25-30K |
4.93% |
7.77% |
63.42 |
|
| £30-35K |
2.97% |
5.79% |
51.22 |
|
| £35-40K |
1.81% |
4.33% |
41.75 |
|
| £40-45K |
1.12% |
3.27% |
34.36 |
|
| £45-50K |
0.71% |
2.48% |
28.56 |
|
| £50-55K |
0.46% |
1.90% |
23.97 |
|
| £55-60K |
0.30% |
1.47% |
20.32 |
|
| £60-65K |
0.20% |
1.15% |
17.39 |
|
| £65-70K |
0.14% |
0.91% |
15.01 |
|
| £70-75K |
0.09% |
0.72% |
13.06 |
|
| £75-80K |
0.07% |
0.57% |
11.46 |
|
| £80-85K |
0.05% |
0.46% |
10.13 |
|
| £85-90K |
0.03% |
0.37% |
9.02 |
|
| £90-95K |
0.02% |
0.31% |
8.08 |
|
| £95-100K |
0.02% |
0.25% |
7.29 |
|
| £100K + |
0.06% |
1.34% |
4.57 |
|
|
|

|


|
1992-1997
|
1997-2001
|
|
|
|
| Con |
-8.38% |
| Lab |
3.13% |
| LD |
2.11% |
|
| Con |
1.76% |
| Lab |
3.37% |
| LD |
-5.85% |
|
|
 |
David Blunkett
Labour hold
|
| Con |
 |
2,601 |
10.18% |
| Lab |
 |
19,650 |
76.90% |
| LD |
 |
2,238 |
8.76% |
| Oth |
 |
1,063 |
4.16% |
| Maj |
 |
17,049 |
66.72% |
| Turn |
 |
25,552 |
46.70% |
|
|
 |
David Blunkett
Labour hold
|
| L |
David Blunkett |
19,650 |
76.90% |
| LD |
Alison Firth |
2,238 |
8.76% |
| SL |
Robert Morris |
354 |
1.39% |
| UK |
Mark Suter |
348 |
1.36% |
| SA |
Brian Wilson |
361 |
1.41% |
| C |
Matthew Wilson |
2,601 |
10.18% |
|
Candidates representing 6 parties stood for election to this seat.
|
|
 |
David Blunkett
Labour
|
| Con |
 |
2,850 |
8.42% |
| Lab |
 |
24,901 |
73.53% |
| LD |
 |
4,947 |
14.61% |
| Ref |
 |
624 |
1.84% |
| Oth |
 |
543 |
1.60% |
| Maj |
 |
19,954 |
58.92% |
| Turn |
 |
33,865 |
57.47% |
|
|
 |
|
Labour
|
| Con |
 |
7,090 |
16.80% |
| Lab |
 |
29,771 |
70.40% |
| LD |
 |
5,273 |
12.50% |
| Oth |
 |
150 |
0.40% |
| Maj |
 |
22,681 |
53.60% |
| Turn |
 |
42,284 |
65.62% |
|
|
 |
|

|

