|
Sheffield, Central
Labour hold

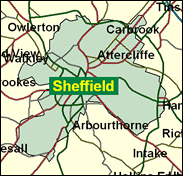
The Liberal Democrats won the Nether Edge and Netherthorpe wards on Sheffield City Council in May 2000, but they are very unlikely to improve on their distant second place in the Central constituency in the 1997 General Election. The seat also includes Manor Park in Manor ward, by popular repute the roughest estate in Sheffield; Sharrow, once of brewing fame, and most of the city centre, its grit given a dramatic and even striking edge by its position among Sheffield's precipitous hills.

Dick Caborn, Minister of State at the DTI, was elected here in 1983 as a semi-hard leftwing replacement for one of Labour's 'faceless Freds', the somnolent rightwinger, Fred Mulley. With only two years as an Opposition spokesman before 1997, he owes his ministerial career to John Prescott, having run his leadership campaign. Equally he owes to the Prescott connection his reshuffling sideways out of Prescott's Environment department in 1999, as Blair sought to intrude more Blairite figures throughout the government. A trim-bearded blunt Yorkshireman and one of Labour's former proles, as an engineering worker and shop steward, he was born in 1943 and attended Hurlfield Comprehensive School, FE college and Sheffield Polytechnic. His own backing for regional government was reflected in his ministerial responsibility for setting up regional development agencies in 1999.
 |
| Wealthy Achievers, Suburban Areas |
4.35% |
14.99% |
29.02 |
|
| Affluent Greys, Rural Communities |
0.05% |
2.13% |
2.36 |
|
| Prosperous Pensioners, Retirement Areas |
0.64% |
2.49% |
25.81 |
|
| Affluent Executives, Family Areas |
0.05% |
4.43% |
1.11 |
|
| Well-Off Workers, Family Areas |
0.00% |
7.27% |
0.00 |
|
| Affluent Urbanites, Town & City Areas |
6.71% |
2.56% |
261.57 |
|
| Prosperous Professionals, Metropolitan Areas |
0.65% |
2.04% |
31.70 |
|
| Better-Off Executives, Inner City Areas |
24.40% |
3.94% |
618.65 |
|
| Comfortable Middle Agers, Mature Home Owning Areas |
1.93% |
13.04% |
14.79 |
|
| Skilled Workers, Home Owning Areas |
6.74% |
12.70% |
53.04 |
|
| New Home Owners, Mature Communities |
2.83% |
8.14% |
34.75 |
|
| White Collar Workers, Better-Off Multi Ethnic Areas |
8.11% |
4.02% |
201.71 |
|
| Older People, Less Prosperous Areas |
4.52% |
3.19% |
141.78 |
|
| Council Estate Residents, Better-Off Homes |
17.23% |
11.31% |
152.32 |
|
| Council Estate Residents, High Unemployment |
14.29% |
3.06% |
466.80 |
|
| Council Estate Residents, Greatest Hardship |
4.52% |
2.52% |
179.28 |
|
| People in Multi-Ethnic, Low-Income Areas |
2.98% |
2.10% |
142.00 |
|
| Unclassified |
0.01% |
0.06% |
18.84 |
|
|
 |
 |
 |
| £0-5K |
17.98% |
9.41% |
191.02 |
|
| £5-10K |
24.08% |
16.63% |
144.79 |
|
| £10-15K |
18.71% |
16.58% |
112.85 |
|
| £15-20K |
12.47% |
13.58% |
91.84 |
|
| £20-25K |
8.09% |
10.39% |
77.85 |
|
| £25-30K |
5.31% |
7.77% |
68.26 |
|
| £30-35K |
3.56% |
5.79% |
61.49 |
|
| £35-40K |
2.45% |
4.33% |
56.59 |
|
| £40-45K |
1.73% |
3.27% |
52.96 |
|
| £45-50K |
1.25% |
2.48% |
50.22 |
|
| £50-55K |
0.92% |
1.90% |
48.13 |
|
| £55-60K |
0.69% |
1.47% |
46.52 |
|
| £60-65K |
0.52% |
1.15% |
45.27 |
|
| £65-70K |
0.40% |
0.91% |
44.31 |
|
| £70-75K |
0.31% |
0.72% |
43.57 |
|
| £75-80K |
0.25% |
0.57% |
43.01 |
|
| £80-85K |
0.20% |
0.46% |
42.60 |
|
| £85-90K |
0.16% |
0.37% |
42.31 |
|
| £90-95K |
0.13% |
0.31% |
42.13 |
|
| £95-100K |
0.11% |
0.25% |
42.02 |
|
| £100K + |
0.59% |
1.34% |
43.72 |
|
|
|

|


|
1992-1997
|
1997-2001
|
|
|
|
| Con |
-6.78% |
| Lab |
4.05% |
| LD |
-1.68% |
|
| Con |
-0.98% |
| Lab |
-2.20% |
| LD |
2.51% |
|
|
 |
Richard Caborn
Labour hold
|
| Con |
 |
3,289 |
10.94% |
| Lab |
 |
18,477 |
61.45% |
| LD |
 |
5,933 |
19.73% |
| Oth |
 |
2,370 |
7.88% |
| Maj |
 |
12,544 |
41.72% |
| Turn |
 |
30,069 |
48.48% |
|
|
 |
Richard Caborn
Labour hold
|
| C |
Noelle Brelsford |
3,289 |
10.94% |
| L |
Richard Caborn |
18,477 |
61.45% |
| WRP |
Michael Driver |
62 |
0.21% |
| SL |
David Hadfield |
289 |
0.96% |
| G |
Bernard Little |
1,008 |
3.35% |
| LD |
Ali Qadar |
5,933 |
19.73% |
| SA |
Nick Riley |
754 |
2.51% |
| UK |
Charlotte Schofield |
257 |
0.85% |
|
Candidates representing 8 parties stood for election to this seat.
|
|
 |
Richard Caborn
Labour
|
| Con |
 |
4,341 |
11.92% |
| Lab |
 |
23,179 |
63.65% |
| LD |
 |
6,273 |
17.22% |
| Ref |
 |
863 |
2.37% |
| Oth |
 |
1,763 |
4.84% |
| Maj |
 |
16,906 |
46.42% |
| Turn |
 |
36,419 |
53.04% |
|
|
 |
|
Labour
|
| Con |
 |
7,983 |
18.70% |
| Lab |
 |
25,448 |
59.60% |
| LD |
 |
8,068 |
18.90% |
| Oth |
 |
1,181 |
2.80% |
| Maj |
 |
17,380 |
40.70% |
| Turn |
 |
42,680 |
59.29% |
|
|
 |
|

|

