|
Sheffield, Hallam
Liberal Democrat hold

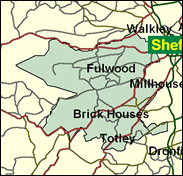
The very middle class (at 59pc, its proportion of those employed in professional and managerial occupations is the third highest in Britain and the highest of all outside the fashionable areas of London) and attractive south-western residential area of Sheffield is now solidly Liberal Democrat at both parliamentary and city council levels, and the sophisticated voters know who to vote for to keep the Tories out. In 1997 the Liberal Democrat share of the vote rose by 20.6pc, their highest increase anywhere, while Labour dropped by 5 per cent, their fourth worst showing. As long as the party of the Right is widely perceived as in the wrong on most issues, the winner here in Ecclesall and Dore, Broomhill and Crookes, Ranmoor and Fulwood, will be Richard Allan.

Richard Allan, a Liberal Democrat Education spokesman (with responsibility for computers), was elected in 1997. Tufted-haired and fastidiously minimally-bearded, he came with a public-school (Oundle) and Cambridge (Pembroke) education and a penchant for information technology, which had previously provided him with employment in the NHS. Classless-seeming, although an obvious beneficiary of the 1997 anti-Tory tactical voting landslide, as Liberal MP in Sheffield he has to live with his party's local antipathy to Labour with whom they vie for control of the city council.
 |
| Wealthy Achievers, Suburban Areas |
49.22% |
14.99% |
328.26 |
|
| Affluent Greys, Rural Communities |
0.00% |
2.13% |
0.00 |
|
| Prosperous Pensioners, Retirement Areas |
2.30% |
2.49% |
92.35 |
|
| Affluent Executives, Family Areas |
2.00% |
4.43% |
45.18 |
|
| Well-Off Workers, Family Areas |
0.81% |
7.27% |
11.20 |
|
| Affluent Urbanites, Town & City Areas |
12.60% |
2.56% |
491.16 |
|
| Prosperous Professionals, Metropolitan Areas |
4.93% |
2.04% |
241.55 |
|
| Better-Off Executives, Inner City Areas |
9.23% |
3.94% |
234.04 |
|
| Comfortable Middle Agers, Mature Home Owning Areas |
7.91% |
13.04% |
60.67 |
|
| Skilled Workers, Home Owning Areas |
0.00% |
12.70% |
0.00 |
|
| New Home Owners, Mature Communities |
1.68% |
8.14% |
20.59 |
|
| White Collar Workers, Better-Off Multi Ethnic Areas |
2.88% |
4.02% |
71.71 |
|
| Older People, Less Prosperous Areas |
2.45% |
3.19% |
76.94 |
|
| Council Estate Residents, Better-Off Homes |
0.82% |
11.31% |
7.25 |
|
| Council Estate Residents, High Unemployment |
3.05% |
3.06% |
99.54 |
|
| Council Estate Residents, Greatest Hardship |
0.00% |
2.52% |
0.00 |
|
| People in Multi-Ethnic, Low-Income Areas |
0.00% |
2.10% |
0.00 |
|
| Unclassified |
0.13% |
0.06% |
202.41 |
|
|
 |
 |
 |
| £0-5K |
7.11% |
9.41% |
75.53 |
|
| £5-10K |
11.84% |
16.63% |
71.16 |
|
| £10-15K |
12.88% |
16.58% |
77.68 |
|
| £15-20K |
11.86% |
13.58% |
87.34 |
|
| £20-25K |
10.18% |
10.39% |
97.97 |
|
| £25-30K |
8.45% |
7.77% |
108.64 |
|
| £30-35K |
6.89% |
5.79% |
118.93 |
|
| £35-40K |
5.57% |
4.33% |
128.64 |
|
| £40-45K |
4.50% |
3.27% |
137.71 |
|
| £45-50K |
3.63% |
2.48% |
146.15 |
|
| £50-55K |
2.93% |
1.90% |
153.99 |
|
| £55-60K |
2.38% |
1.47% |
161.27 |
|
| £60-65K |
1.93% |
1.15% |
168.05 |
|
| £65-70K |
1.58% |
0.91% |
174.38 |
|
| £70-75K |
1.30% |
0.72% |
180.30 |
|
| £75-80K |
1.07% |
0.57% |
185.86 |
|
| £80-85K |
0.88% |
0.46% |
191.11 |
|
| £85-90K |
0.73% |
0.37% |
196.06 |
|
| £90-95K |
0.61% |
0.31% |
200.77 |
|
| £95-100K |
0.51% |
0.25% |
205.25 |
|
| £100K + |
3.12% |
1.34% |
231.94 |
|
|
|

|


|
1992-1997
|
1997-2001
|
|
|
|
| Con |
-16.46% |
| Lab |
-4.88% |
| LD |
20.63% |
|
| Con |
-2.15% |
| Lab |
-1.08% |
| LD |
4.11% |
|
|
 |
Richard Allan
Liberal Democrat hold
|
| Con |
 |
11,856 |
31.00% |
| Lab |
 |
4,758 |
12.44% |
| LD |
 |
21,203 |
55.44% |
| Oth |
 |
429 |
1.12% |
| Maj |
 |
9,347 |
24.44% |
| Turn |
 |
38,246 |
63.44% |
|
|
 |
Richard Allan
Liberal Democrat hold
|
| LD |
Richard Allan |
21,203 |
55.44% |
| UK |
Leslie Arnott |
429 |
1.12% |
| L |
Gillian Furniss |
4,758 |
12.44% |
| C |
John Harthman |
11,856 |
31.00% |
|
Candidates representing 4 parties stood for election to this seat.
|
|
 |
Richard Allan
Liberal Democrat gain
|
| Con |
 |
15,074 |
33.14% |
| Lab |
 |
6,147 |
13.52% |
| LD |
 |
23,345 |
51.33% |
| Ref |
 |
788 |
1.73% |
| Oth |
 |
125 |
0.27% |
| Maj |
 |
8,271 |
18.19% |
| Turn |
 |
45,479 |
72.38% |
|
|
 |
|
Conservative
|
| Con |
 |
22,180 |
49.60% |
| Lab |
 |
8,246 |
18.40% |
| LD |
 |
13,740 |
30.70% |
| Oth |
 |
546 |
1.20% |
| Maj |
 |
8,440 |
18.90% |
| Turn |
 |
44,712 |
73.14% |
|
|
 |
|

|

