|
Sheffield, Heeley
Labour hold

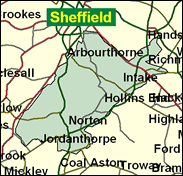
As in several other northern industrial cities, the Liberal Democrats have become the chief opposition to Labour at municipal level: Liverpool is the most long-standing, and dramatically successful, example of this. The Conservative base has been almost completely destroyed in many conurbations. Not only have the Lib Dems taken all the ex-Tory wards, though, but in many cases they have exploited Labour disorganisation and complacency to advance into working-class heartlands. A very good example of this in recent times is the Heeley division of southern Sheffield. In May 2000 the LDs won all five wards here, mostly with substantial margins with the air of permanence. So, does this count as a possible surprise Labour loss at the next general election? In all probability not. The Liberal Democrats find it very difficult to translate their municipal success to parliamentary seats, especially against Labour opposition. They moved up to second here in 1997, but remained 39pc behind Bill Michie, the retiring Labour MP. This is an awfully big gap to close, and they may make very little inroads into it.

In place of the leftwinger, engineer Bill Michie, comes Meg Munn, one of only four women selected to fight Labour-held seats where the MP has retired. A local girl made good, she was Sheffield-born in 1959 and raised in the constituency, joining the Party aged 16, and attending Rowlinson Comprehensive School and York and Nottingham Universities. A social worker, she was until 2000 Assistant Director of Children's Services in York. A Nottingham city councillor for four years (1987-91), strapping and with a pleasant toothy smile, with fluent French and German, she lists Europe as an interest and, rarely for Labour candidates these days, lists Methodist Church membership.
 |
| Wealthy Achievers, Suburban Areas |
3.73% |
14.99% |
24.89 |
|
| Affluent Greys, Rural Communities |
0.00% |
2.13% |
0.00 |
|
| Prosperous Pensioners, Retirement Areas |
0.28% |
2.49% |
11.28 |
|
| Affluent Executives, Family Areas |
0.04% |
4.43% |
0.89 |
|
| Well-Off Workers, Family Areas |
3.14% |
7.27% |
43.22 |
|
| Affluent Urbanites, Town & City Areas |
0.45% |
2.56% |
17.42 |
|
| Prosperous Professionals, Metropolitan Areas |
0.00% |
2.04% |
0.00 |
|
| Better-Off Executives, Inner City Areas |
1.39% |
3.94% |
35.32 |
|
| Comfortable Middle Agers, Mature Home Owning Areas |
19.15% |
13.04% |
146.86 |
|
| Skilled Workers, Home Owning Areas |
18.11% |
12.70% |
142.54 |
|
| New Home Owners, Mature Communities |
9.17% |
8.14% |
112.65 |
|
| White Collar Workers, Better-Off Multi Ethnic Areas |
2.65% |
4.02% |
65.87 |
|
| Older People, Less Prosperous Areas |
7.98% |
3.19% |
250.60 |
|
| Council Estate Residents, Better-Off Homes |
22.46% |
11.31% |
198.56 |
|
| Council Estate Residents, High Unemployment |
8.12% |
3.06% |
265.27 |
|
| Council Estate Residents, Greatest Hardship |
3.32% |
2.52% |
131.95 |
|
| People in Multi-Ethnic, Low-Income Areas |
0.00% |
2.10% |
0.00 |
|
| Unclassified |
0.00% |
0.06% |
0.00 |
|
|
 |
 |
 |
| £0-5K |
14.83% |
9.41% |
157.55 |
|
| £5-10K |
22.62% |
16.63% |
135.98 |
|
| £10-15K |
19.30% |
16.58% |
116.39 |
|
| £15-20K |
13.72% |
13.58% |
101.00 |
|
| £20-25K |
9.24% |
10.39% |
88.91 |
|
| £25-30K |
6.16% |
7.77% |
79.23 |
|
| £30-35K |
4.13% |
5.79% |
71.35 |
|
| £35-40K |
2.81% |
4.33% |
64.84 |
|
| £40-45K |
1.94% |
3.27% |
59.39 |
|
| £45-50K |
1.36% |
2.48% |
54.77 |
|
| £50-55K |
0.97% |
1.90% |
50.83 |
|
| £55-60K |
0.70% |
1.47% |
47.42 |
|
| £60-65K |
0.51% |
1.15% |
44.45 |
|
| £65-70K |
0.38% |
0.91% |
41.85 |
|
| £70-75K |
0.28% |
0.72% |
39.54 |
|
| £75-80K |
0.22% |
0.57% |
37.49 |
|
| £80-85K |
0.16% |
0.46% |
35.65 |
|
| £85-90K |
0.13% |
0.37% |
33.99 |
|
| £90-95K |
0.10% |
0.31% |
32.48 |
|
| £95-100K |
0.08% |
0.25% |
31.11 |
|
| £100K + |
0.33% |
1.34% |
24.79 |
|
|
|

|


|
1992-1997
|
1997-2001
|
|
|
|
| Con |
-10.26% |
| Lab |
5.03% |
| LD |
2.85% |
|
| Con |
-1.39% |
| Lab |
-3.75% |
| LD |
1.44% |
|
|
 |
Meg Munn
Labour hold
|
| Con |
 |
4,864 |
14.25% |
| Lab |
 |
19,452 |
56.98% |
| LD |
 |
7,748 |
22.70% |
| Oth |
 |
2,075 |
6.08% |
| Maj |
 |
11,704 |
34.28% |
| Turn |
 |
34,139 |
54.40% |
|
|
 |
Meg Munn
Labour hold
|
| C |
Carolyn Abbott |
4,864 |
14.25% |
| UK |
David Dunn |
634 |
1.86% |
| SL |
Brian Fischer |
667 |
1.95% |
| L |
Meg Munn |
19,452 |
56.98% |
| G |
Rob Unwin |
774 |
2.27% |
| LD |
David Willis |
7,748 |
22.70% |
|
Candidates representing 6 parties stood for election to this seat.
|
|
 |
Bill Michie
Labour
|
| Con |
 |
6,767 |
15.64% |
| Lab |
 |
26,274 |
60.73% |
| LD |
 |
9,196 |
21.25% |
| Ref |
 |
1,029 |
2.38% |
| Oth |
|
0 |
0.00% |
| Maj |
 |
17,078 |
39.47% |
| Turn |
 |
43,266 |
64.96% |
|
|
 |
|
Labour
|
| Con |
 |
13,051 |
25.90% |
| Lab |
 |
28,005 |
55.70% |
| LD |
 |
9,247 |
18.40% |
| Oth |
|
0 |
0.00% |
| Maj |
 |
14,954 |
29.70% |
| Turn |
 |
50,303 |
70.35% |
|
|
 |
|

|

