|
Sherwood
Labour hold

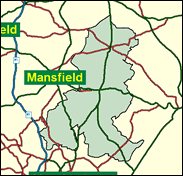
The Nottinghamshire coalfield, already a substantial economic and social element in the east Midlands in the nineteenth century, was one of the few to expand greatly in the twentieth, as the coal seams which shelve deeper as one passes eastwards were exploited for the first time. Much of this development took place under the remanants of Sherwood Forest, an area also known as the Dukeries after the large aristocratic landed estates of such as the Dukes of Portland and Newcastle, Earl Manvers and Lord Savile, which were transformed in a small industrial revolution in the 1920s and 1930s, almost within living memory. This area, around Ollerton and Edwinstowe, Bilsthorpe and Blidworth and Clipstone, was taken out of the Newark seat in 1983 and placed with the older coalfield of the Leen valley near Hucknall to form a seat of its own. Yet this division, Sherwood, was won by a Tory farmer, Andrew Stewart, in its first two contests in 1983 and 1987. This surprised many economic determinists, but in retrospect it is explicable, as is Sherwood's subsequent transformation into a safe Labour seat. 1983 was the high water mark of Thatcherism, and Labour's lowest ebb. In 1987, the Nottinghamshire coalfield, always regarded as moderate, had been pushed to the right by Arthur Scargill's declaration of a major coal strike without its agreement. By 1992 the enemy seemed to be the Tories, as pits were closed even in areas which had worked in the great conflict of 1984-85; and in 1997 the standard national swing lifted Paddy Tipping's majority to nearly 17,000.

Paddy Tipping, elected here in 1992, is deputy to Margaret Beckett as Leader of the House, but was dubbed (by Matthew Parris) as "so unimportant that New Labour's style police have not even bothered to remove his beard," and as having a name that "sounds like an alternative Saturday night sport for canal-side skinheads bored with queer-bashing". A former Nottinghamshire County Councillor, a social worker, he was born 1949, and educated at Hipperholme Grammar School, Halifax and Nottingham University. A voter in 1994 for Beckett, not Blair, he has resisted coal industry decline even under Labour, and can also be construed as a bit of a nuisance as a keen "Right to Roamer." But his on-message defence of Labour's House of Lords reforms provoked a backbench revolt against prime ministerial patronage in 1999.
 |
| Wealthy Achievers, Suburban Areas |
21.26% |
14.99% |
141.83 |
|
| Affluent Greys, Rural Communities |
0.12% |
2.13% |
5.59 |
|
| Prosperous Pensioners, Retirement Areas |
0.29% |
2.49% |
11.77 |
|
| Affluent Executives, Family Areas |
8.45% |
4.43% |
190.88 |
|
| Well-Off Workers, Family Areas |
7.86% |
7.27% |
108.08 |
|
| Affluent Urbanites, Town & City Areas |
0.24% |
2.56% |
9.30 |
|
| Prosperous Professionals, Metropolitan Areas |
0.00% |
2.04% |
0.00 |
|
| Better-Off Executives, Inner City Areas |
0.00% |
3.94% |
0.00 |
|
| Comfortable Middle Agers, Mature Home Owning Areas |
8.01% |
13.04% |
61.45 |
|
| Skilled Workers, Home Owning Areas |
25.33% |
12.70% |
199.39 |
|
| New Home Owners, Mature Communities |
16.01% |
8.14% |
196.64 |
|
| White Collar Workers, Better-Off Multi Ethnic Areas |
0.02% |
4.02% |
0.58 |
|
| Older People, Less Prosperous Areas |
2.63% |
3.19% |
82.50 |
|
| Council Estate Residents, Better-Off Homes |
7.45% |
11.31% |
65.83 |
|
| Council Estate Residents, High Unemployment |
0.41% |
3.06% |
13.23 |
|
| Council Estate Residents, Greatest Hardship |
1.86% |
2.52% |
73.86 |
|
| People in Multi-Ethnic, Low-Income Areas |
0.00% |
2.10% |
0.00 |
|
| Unclassified |
0.06% |
0.06% |
98.67 |
|
|
 |
 |
 |
| £0-5K |
10.23% |
9.41% |
108.67 |
|
| £5-10K |
18.47% |
16.63% |
111.05 |
|
| £10-15K |
17.96% |
16.58% |
108.31 |
|
| £15-20K |
14.11% |
13.58% |
103.89 |
|
| £20-25K |
10.31% |
10.39% |
99.22 |
|
| £25-30K |
7.38% |
7.77% |
94.93 |
|
| £30-35K |
5.28% |
5.79% |
91.21 |
|
| £35-40K |
3.82% |
4.33% |
88.09 |
|
| £40-45K |
2.79% |
3.27% |
85.49 |
|
| £45-50K |
2.07% |
2.48% |
83.35 |
|
| £50-55K |
1.55% |
1.90% |
81.58 |
|
| £55-60K |
1.18% |
1.47% |
80.11 |
|
| £60-65K |
0.91% |
1.15% |
78.89 |
|
| £65-70K |
0.71% |
0.91% |
77.87 |
|
| £70-75K |
0.55% |
0.72% |
77.01 |
|
| £75-80K |
0.44% |
0.57% |
76.29 |
|
| £80-85K |
0.35% |
0.46% |
75.68 |
|
| £85-90K |
0.28% |
0.37% |
75.16 |
|
| £90-95K |
0.23% |
0.31% |
74.72 |
|
| £95-100K |
0.19% |
0.25% |
74.35 |
|
| £100K + |
0.98% |
1.34% |
73.05 |
|
|
|

|


|
1992-1997
|
1997-2001
|
|
|
|
| Con |
-14.14% |
| Lab |
11.00% |
| LD |
-0.95% |
|
| Con |
5.07% |
| Lab |
-4.25% |
| LD |
3.28% |
|
|
 |
Paddy Tipping
Labour hold
|
| Con |
 |
15,527 |
33.83% |
| Lab |
 |
24,900 |
54.25% |
| LD |
 |
5,473 |
11.92% |
| Oth |
|
0 |
0.00% |
| Maj |
 |
9,373 |
20.42% |
| Turn |
 |
45,900 |
60.66% |
|
|
 |
Paddy Tipping
Labour hold
|
| LD |
Peter Harris |
5,473 |
11.92% |
| C |
Brandon Lewis |
15,527 |
33.83% |
| L |
Paddy Tipping |
24,900 |
54.25% |
|
Candidates representing 3 parties stood for election to this seat.
|
|
 |
Paddy Tipping
Labour
|
| Con |
 |
16,259 |
28.76% |
| Lab |
 |
33,071 |
58.50% |
| LD |
 |
4,889 |
8.65% |
| Ref |
 |
1,882 |
3.33% |
| Oth |
 |
432 |
0.76% |
| Maj |
 |
16,812 |
29.74% |
| Turn |
 |
56,533 |
75.59% |
|
|
 |
|
Labour
|
| Con |
 |
26,878 |
42.90% |
| Lab |
 |
29,788 |
47.50% |
| LD |
 |
6,039 |
9.60% |
| Oth |
|
0 |
0.00% |
| Maj |
 |
2,910 |
4.60% |
| Turn |
 |
62,705 |
84.58% |
|
|
 |
|

|

