|
Shipley
Labour hold

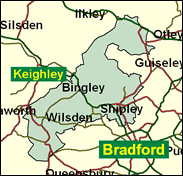
The youngest MP elected in 1997, Christopher Leslie faces a very great task to win again, in this Shipley seat at least. In the 2000 local elections, for example, Labour could only win - or come near winning - one ward (Shipley East) of the six from Bradford Metropolitan Borough (covering Bingley and Baildon and stretches of moorland fringed by villages as well as Titus Salt's 19th century company town of Saltaire) included in the constituency. They also achieved their fifth weakest performance in any Labour-held seat in the 1999 Euro elections, 20pc behind the Conservatives. Leslie won last time by 3,000. He will do well not to lose in 2001 by at least that amount.

Chris Leslie, Labour's youngest MP and the Baby of the House until the arrival of Tottenham's David Lammy in 2000, came in on the 1997 landslide and within a year was the first of the intake to become a PPS, in his case to Lord Falconer. Seen by Tory detractors as having "a slavish desire to ingratiate himself with his masters", he was born in 1972, educated at Bingley Grammar School and Leeds University, and previously worked for Bradford Labour Party and for a Bradford councillor. For the Conservatives - and coming round for the third time in parliamentary contests - is David Senior, a former ICI marketing manager for eleven years. Born 1959 and educated at King's School, Macclesfield and Jesus College, Cambridge, after losing Luton North to Labour in 1997 he ran the Millennium Arts Festival for Schools to stress the Christian meaning of the millennium. An effective conference orator, he has helped craft orations for Francis Maude as Shadow Chancellor.

 |
| Wealthy Achievers, Suburban Areas |
27.92% |
14.99% |
186.23 |
|
| Affluent Greys, Rural Communities |
0.00% |
2.13% |
0.00 |
|
| Prosperous Pensioners, Retirement Areas |
2.90% |
2.49% |
116.64 |
|
| Affluent Executives, Family Areas |
4.83% |
4.43% |
109.05 |
|
| Well-Off Workers, Family Areas |
8.87% |
7.27% |
121.99 |
|
| Affluent Urbanites, Town & City Areas |
0.83% |
2.56% |
32.24 |
|
| Prosperous Professionals, Metropolitan Areas |
0.57% |
2.04% |
27.86 |
|
| Better-Off Executives, Inner City Areas |
0.08% |
3.94% |
2.08 |
|
| Comfortable Middle Agers, Mature Home Owning Areas |
15.68% |
13.04% |
120.26 |
|
| Skilled Workers, Home Owning Areas |
12.02% |
12.70% |
94.63 |
|
| New Home Owners, Mature Communities |
6.38% |
8.14% |
78.31 |
|
| White Collar Workers, Better-Off Multi Ethnic Areas |
5.34% |
4.02% |
132.76 |
|
| Older People, Less Prosperous Areas |
4.10% |
3.19% |
128.56 |
|
| Council Estate Residents, Better-Off Homes |
6.33% |
11.31% |
55.94 |
|
| Council Estate Residents, High Unemployment |
1.97% |
3.06% |
64.17 |
|
| Council Estate Residents, Greatest Hardship |
0.37% |
2.52% |
14.67 |
|
| People in Multi-Ethnic, Low-Income Areas |
1.83% |
2.10% |
87.00 |
|
| Unclassified |
0.00% |
0.06% |
0.00 |
|
|
 |
 |
 |
| £0-5K |
7.94% |
9.41% |
84.32 |
|
| £5-10K |
14.58% |
16.63% |
87.68 |
|
| £10-15K |
15.47% |
16.58% |
93.29 |
|
| £15-20K |
13.41% |
13.58% |
98.72 |
|
| £20-25K |
10.75% |
10.39% |
103.44 |
|
| £25-30K |
8.35% |
7.77% |
107.41 |
|
| £30-35K |
6.41% |
5.79% |
110.70 |
|
| £35-40K |
4.91% |
4.33% |
113.41 |
|
| £40-45K |
3.78% |
3.27% |
115.64 |
|
| £45-50K |
2.92% |
2.48% |
117.44 |
|
| £50-55K |
2.26% |
1.90% |
118.89 |
|
| £55-60K |
1.77% |
1.47% |
120.03 |
|
| £60-65K |
1.39% |
1.15% |
120.91 |
|
| £65-70K |
1.10% |
0.91% |
121.55 |
|
| £70-75K |
0.88% |
0.72% |
121.99 |
|
| £75-80K |
0.70% |
0.57% |
122.26 |
|
| £80-85K |
0.57% |
0.46% |
122.37 |
|
| £85-90K |
0.46% |
0.37% |
122.35 |
|
| £90-95K |
0.37% |
0.31% |
122.22 |
|
| £95-100K |
0.30% |
0.25% |
121.98 |
|
| £100K + |
1.58% |
1.34% |
117.60 |
|
|
|

|


|
1992-1997
|
1997-2001
|
|
|
|
| Con |
-12.64% |
| Lab |
14.93% |
| LD |
-4.90% |
|
| Con |
3.12% |
| Lab |
0.56% |
| LD |
-4.24% |
|
|
 |
Christopher Leslie
Labour hold
|
| Con |
 |
18,815 |
40.88% |
| Lab |
 |
20,243 |
43.99% |
| LD |
 |
4,996 |
10.86% |
| Oth |
 |
1,966 |
4.27% |
| Maj |
 |
1,428 |
3.10% |
| Turn |
 |
46,020 |
66.14% |
|
|
 |
Christopher Leslie
Labour hold
|
| L |
Christopher Leslie |
20,243 |
43.99% |
| G |
Martin Love |
1,386 |
3.01% |
| C |
David Senior |
18,815 |
40.88% |
| UK |
Walter Whitacker |
580 |
1.26% |
| LD |
Helen Wright |
4,996 |
10.86% |
|
Candidates representing 5 parties stood for election to this seat.
|
|
 |
Christopher Leslie
Labour gain
|
| Con |
 |
19,966 |
37.76% |
| Lab |
 |
22,962 |
43.43% |
| LD |
 |
7,984 |
15.10% |
| Ref |
 |
1,960 |
3.71% |
| Oth |
|
0 |
0.00% |
| Maj |
 |
2,996 |
5.67% |
| Turn |
 |
52,872 |
76.32% |
|
|
 |
|
Conservative
|
| Con |
 |
28,463 |
50.40% |
| Lab |
 |
16,081 |
28.50% |
| LD |
 |
11,288 |
20.00% |
| Oth |
 |
680 |
1.20% |
| Maj |
 |
12,382 |
21.90% |
| Turn |
 |
56,512 |
81.16% |
|
|
 |
|

|

