|
Shrewsbury & Atcham
Labour hold

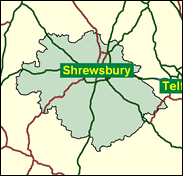
Deluged by the Severn floods in the latter part of 2000, Shrewsbury may well now see the ebb of Labour's high tide of electoral fortune, which led to their first ever victory here in the 1997 General Election. This will not be because they are blamed for the water damage and inconvenience, but any recovery at all by the Conservatives from their dire showing after 18 years and four full terms of government will bring this seat back to its traditional allegiance. In the May 2000 elections in the borough which shares the name and exact boundaries of the parliamentary constituency the Tories led by 9pc, and this suggests that they are favourites to achieve just that.

Labour's unexpected MP, Paul Marsden, equally unexpectedly announced he would quit in January 2001, over an alleged spat in the local Labour Party, and then unexpectedly "de-quit" in February. One of Labour's youngest MPs in the 1997 intake - unkindly dubbed by his defeated Tory opponent Derek Conway as "a Labour nerd" - he was born in 1968, educated at Helsby High School and Teesside Polytechnic, and previously worked as a quality assurance manager. After four low-profile years seeking to reassure beleaguered farmers in a seat Labour never dreamt of winning, he came to prominence early this year when he called for legislation on recyclable waste. Targeting the seat for the Conservatives is Anthea McIntyre, single, London-born in 1954 and educated at Queen's College, Harley Street, but Herefordshire-based, and Director of MCP Systems Consultants, specialising in business intelligence systems. Long active in the Party and an experienced campaigner, she fought Warley West in 1983 and Redditch in 1997. Statistically the Conservatives' third most likely new woman MP in this election, she has objected to being press-listed as a 'Europhile.'
 |
| Wealthy Achievers, Suburban Areas |
21.25% |
14.99% |
141.73 |
|
| Affluent Greys, Rural Communities |
5.83% |
2.13% |
274.06 |
|
| Prosperous Pensioners, Retirement Areas |
1.18% |
2.49% |
47.54 |
|
| Affluent Executives, Family Areas |
4.37% |
4.43% |
98.79 |
|
| Well-Off Workers, Family Areas |
12.56% |
7.27% |
172.69 |
|
| Affluent Urbanites, Town & City Areas |
0.74% |
2.56% |
28.72 |
|
| Prosperous Professionals, Metropolitan Areas |
0.99% |
2.04% |
48.33 |
|
| Better-Off Executives, Inner City Areas |
0.59% |
3.94% |
14.87 |
|
| Comfortable Middle Agers, Mature Home Owning Areas |
20.12% |
13.04% |
154.32 |
|
| Skilled Workers, Home Owning Areas |
6.73% |
12.70% |
52.98 |
|
| New Home Owners, Mature Communities |
8.51% |
8.14% |
104.52 |
|
| White Collar Workers, Better-Off Multi Ethnic Areas |
5.23% |
4.02% |
130.04 |
|
| Older People, Less Prosperous Areas |
2.21% |
3.19% |
69.40 |
|
| Council Estate Residents, Better-Off Homes |
8.51% |
11.31% |
75.25 |
|
| Council Estate Residents, High Unemployment |
0.70% |
3.06% |
22.71 |
|
| Council Estate Residents, Greatest Hardship |
0.33% |
2.52% |
13.03 |
|
| People in Multi-Ethnic, Low-Income Areas |
0.00% |
2.10% |
0.00 |
|
| Unclassified |
0.16% |
0.06% |
257.40 |
|
|
 |
 |
 |
| £0-5K |
8.88% |
9.41% |
94.35 |
|
| £5-10K |
17.20% |
16.63% |
103.39 |
|
| £10-15K |
17.77% |
16.58% |
107.16 |
|
| £15-20K |
14.59% |
13.58% |
107.39 |
|
| £20-25K |
10.97% |
10.39% |
105.59 |
|
| £25-30K |
7.98% |
7.77% |
102.69 |
|
| £30-35K |
5.75% |
5.79% |
99.30 |
|
| £35-40K |
4.15% |
4.33% |
95.74 |
|
| £40-45K |
3.01% |
3.27% |
92.21 |
|
| £45-50K |
2.21% |
2.48% |
88.84 |
|
| £50-55K |
1.63% |
1.90% |
85.67 |
|
| £55-60K |
1.22% |
1.47% |
82.74 |
|
| £60-65K |
0.92% |
1.15% |
80.05 |
|
| £65-70K |
0.70% |
0.91% |
77.60 |
|
| £70-75K |
0.54% |
0.72% |
75.36 |
|
| £75-80K |
0.42% |
0.57% |
73.34 |
|
| £80-85K |
0.33% |
0.46% |
71.50 |
|
| £85-90K |
0.26% |
0.37% |
69.84 |
|
| £90-95K |
0.21% |
0.31% |
68.33 |
|
| £95-100K |
0.17% |
0.25% |
66.96 |
|
| £100K + |
0.82% |
1.34% |
61.25 |
|
|
|

|


|
1992-1997
|
1997-2001
|
|
|
|
| Con |
-11.81% |
| Lab |
11.01% |
| LD |
-2.00% |
|
| Con |
3.42% |
| Lab |
7.58% |
| LD |
-12.64% |
|
|
 |
Paul Marsden
Labour hold
|
| Con |
 |
18,674 |
37.42% |
| Lab |
 |
22,253 |
44.59% |
| LD |
 |
6,173 |
12.37% |
| Oth |
 |
2,809 |
5.63% |
| Maj |
 |
3,579 |
7.17% |
| Turn |
 |
49,909 |
66.58% |
|
|
 |
Paul Marsden
Labour hold
|
| G |
Emma Bullard |
931 |
1.87% |
| UK |
Henry Curteis |
1,620 |
3.25% |
| I |
James Gollins |
258 |
0.52% |
| L |
Paul Marsden |
22,253 |
44.59% |
| C |
Anthea McIntyre |
18,674 |
37.42% |
| LD |
Jonathan Rule |
6,173 |
12.37% |
|
Candidates representing 6 parties stood for election to this seat.
|
|
 |
Paul Marsden
Labour gain
|
| Con |
 |
18,814 |
33.99% |
| Lab |
 |
20,484 |
37.01% |
| LD |
 |
13,838 |
25.00% |
| Ref |
 |
1,346 |
2.43% |
| Oth |
 |
862 |
1.56% |
| Maj |
 |
1,670 |
3.02% |
| Turn |
 |
55,344 |
75.25% |
|
|
 |
|
Conservative
|
| Con |
 |
26,681 |
45.80% |
| Lab |
 |
15,157 |
26.00% |
| LD |
 |
15,716 |
27.00% |
| Oth |
 |
677 |
1.20% |
| Maj |
 |
10,965 |
18.80% |
| Turn |
 |
58,231 |
77.59% |
|
|
 |
|

|

