|
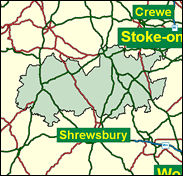
Shropshire North
Conservative hold

Local politics do not offer a very clear guide to the breakdown of the political and electoral structure of North Shropshire. This is one of the few parts of the country where Independents still rule, and there are also a number of unopposed returns, including some which allow Labour councillors to take their seats in the industrial area bordering Wrexham's old coalfield, and in Market Drayton and Oswestry, after which this seat used to be named before 1983. However, although Labour cut the new candidate Owen Paterson's majority to just 2,000 after 36 years of thoughtful and independent, even semi-detached, Tory representation by John Biffen, they have never won in this little-visited part of the Welsh borders.

Owen Patterson, an Opposition Whip and a welcome toff amidst the suburban dross of contemporary Tory MPs, was elected in 1997 as the charming-if-abrasively partisan, Radley and Cambridge (Corpus Christi)-educated, son-in-law of Viscount Ridley. Born 1956, he previously worked with his family's British Leather Company from 1979, and was by 1993 its managing director. As a pugnacious right-winger who backed Redwood in 1997, he campaigns against all legislation affecting the countryside, whether beef bans, high fuel duty, hunting bans, beleaguered hauliers and monumentally filibustered a Bill to ban fur farming. Good-looking and oozing savoir faire, he also rubbished Welsh devolution as involving "a coachload of superannuated county councillors."
 |
| Wealthy Achievers, Suburban Areas |
21.20% |
14.99% |
141.41 |
|
| Affluent Greys, Rural Communities |
12.40% |
2.13% |
582.98 |
|
| Prosperous Pensioners, Retirement Areas |
1.37% |
2.49% |
55.14 |
|
| Affluent Executives, Family Areas |
1.61% |
4.43% |
36.43 |
|
| Well-Off Workers, Family Areas |
3.20% |
7.27% |
44.03 |
|
| Affluent Urbanites, Town & City Areas |
0.00% |
2.56% |
0.00 |
|
| Prosperous Professionals, Metropolitan Areas |
0.00% |
2.04% |
0.00 |
|
| Better-Off Executives, Inner City Areas |
0.60% |
3.94% |
15.29 |
|
| Comfortable Middle Agers, Mature Home Owning Areas |
24.27% |
13.04% |
186.15 |
|
| Skilled Workers, Home Owning Areas |
10.52% |
12.70% |
82.78 |
|
| New Home Owners, Mature Communities |
11.40% |
8.14% |
139.98 |
|
| White Collar Workers, Better-Off Multi Ethnic Areas |
2.14% |
4.02% |
53.10 |
|
| Older People, Less Prosperous Areas |
3.12% |
3.19% |
97.86 |
|
| Council Estate Residents, Better-Off Homes |
7.22% |
11.31% |
63.81 |
|
| Council Estate Residents, High Unemployment |
0.63% |
3.06% |
20.52 |
|
| Council Estate Residents, Greatest Hardship |
0.32% |
2.52% |
12.78 |
|
| People in Multi-Ethnic, Low-Income Areas |
0.00% |
2.10% |
0.00 |
|
| Unclassified |
0.01% |
0.06% |
12.25 |
|
|
 |
 |
 |
| £0-5K |
9.06% |
9.41% |
96.29 |
|
| £5-10K |
17.10% |
16.63% |
102.82 |
|
| £10-15K |
17.55% |
16.58% |
105.85 |
|
| £15-20K |
14.45% |
13.58% |
106.39 |
|
| £20-25K |
10.93% |
10.39% |
105.16 |
|
| £25-30K |
8.00% |
7.77% |
102.87 |
|
| £30-35K |
5.79% |
5.79% |
100.02 |
|
| £35-40K |
4.20% |
4.33% |
96.94 |
|
| £40-45K |
3.06% |
3.27% |
93.82 |
|
| £45-50K |
2.25% |
2.48% |
90.79 |
|
| £50-55K |
1.67% |
1.90% |
87.89 |
|
| £55-60K |
1.26% |
1.47% |
85.15 |
|
| £60-65K |
0.95% |
1.15% |
82.59 |
|
| £65-70K |
0.73% |
0.91% |
80.18 |
|
| £70-75K |
0.56% |
0.72% |
77.94 |
|
| £75-80K |
0.44% |
0.57% |
75.84 |
|
| £80-85K |
0.34% |
0.46% |
73.88 |
|
| £85-90K |
0.27% |
0.37% |
72.03 |
|
| £90-95K |
0.21% |
0.31% |
70.30 |
|
| £95-100K |
0.17% |
0.25% |
68.67 |
|
| £100K + |
0.81% |
1.34% |
60.03 |
|
|
|

|


|
1992-1997
|
1997-2001
|
|
|
|
| Con |
-10.56% |
| Lab |
9.78% |
| LD |
-2.64% |
|
| Con |
8.41% |
| Lab |
-0.75% |
| LD |
-7.58% |
|
|
 |
Owen Paterson
Conservative hold
|
| Con |
 |
22,631 |
48.65% |
| Lab |
 |
16,390 |
35.23% |
| LD |
 |
5,945 |
12.78% |
| Oth |
 |
1,554 |
3.34% |
| Maj |
 |
6,241 |
13.42% |
| Turn |
 |
46,520 |
63.11% |
|
|
 |
Owen Paterson
Conservative hold
|
| L |
Michael Ion |
16,390 |
35.23% |
| LD |
Ben Jephcott |
5,945 |
12.78% |
| I |
Russell Maxfield |
389 |
0.84% |
| C |
Owen Paterson |
22,631 |
48.65% |
| UK |
David Trevanion |
1,165 |
2.50% |
|
Candidates representing 5 parties stood for election to this seat.
|
|
 |
Owen Patterson
Conservative
|
| Con |
 |
20,730 |
40.24% |
| Lab |
 |
18,535 |
35.98% |
| LD |
 |
10,489 |
20.36% |
| Ref |
 |
1,764 |
3.42% |
| Oth |
|
0 |
0.00% |
| Maj |
 |
2,195 |
4.26% |
| Turn |
 |
51,518 |
72.71% |
|
|
 |
|
Conservative
|
| Con |
 |
27,159 |
50.80% |
| Lab |
 |
13,978 |
26.20% |
| LD |
 |
12,283 |
23.00% |
| Oth |
|
0 |
0.00% |
| Maj |
 |
13,181 |
24.70% |
| Turn |
 |
53,420 |
78.21% |
|
|
 |
|

|

