|
Sittingbourne & Sheppey
Labour hold

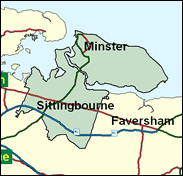
Kent will once again form a major political battleground at the next general election, as Labour tries to hold as many as they can of the eight gains they made in 1997. One of the hardest will be Sittingbourne and Sheppey. In the May 2000 elections in Swale Borough (admittedly not all the wards in the seat were contested that year) Labour won just one, Sheerness West on the Isle of Sheppey. This seat had the second narrowest of the margins of gain in 1997, and returned the second largest Tory lead in the 1999 Euro-elections (when they would have regained all eight). Along with Gillingham and Thanet South, this represents the Conservatives' absolute minimum in the list of targets for rapid recovery.

Derek Wyatt, Labour's 13th least expected winner in 1997, and described as "on the butch wing of the Culture, Media and Sports Select Committee," is a big shambling man with a nose broken by rugby. Born 1949 and educated elongatedly at Westcliff County High School, Colchester Royal Grammar School, St Luke's College Exeter, St Catherine's College Oxford, and the Open University, he comes from a background in satellite (BSkyB) television, but as an MP has majored in computing, and particularly the internet and email, overlain with a populist concern for sport. A bemoaner of North Kent's "necklace of poverty", he has also rebelled, on predatory newspaper pricing and against the Freedom of Information Bill's exclusion of policy advice. His would-be Conservative replacement is Adrian Lee, equally into "communications" as a marketing manager with a mobile phone company. Born 1966 and a Tory since the age of 15, he was educated at Ealing College and Thames Polytechnic, was National Young Conservative Chairman in 1994, fought Tynebridge in 1997 and got onto Hounslow Council in 1998. He was formerly PA to the Europhobic whipless rebel, Christopher Gill MP, the departing "Butcher of Ludlow."
 |
| Wealthy Achievers, Suburban Areas |
10.01% |
14.99% |
66.78 |
|
| Affluent Greys, Rural Communities |
0.87% |
2.13% |
41.08 |
|
| Prosperous Pensioners, Retirement Areas |
0.79% |
2.49% |
31.81 |
|
| Affluent Executives, Family Areas |
4.75% |
4.43% |
107.35 |
|
| Well-Off Workers, Family Areas |
10.93% |
7.27% |
150.33 |
|
| Affluent Urbanites, Town & City Areas |
0.16% |
2.56% |
6.11 |
|
| Prosperous Professionals, Metropolitan Areas |
0.00% |
2.04% |
0.00 |
|
| Better-Off Executives, Inner City Areas |
0.16% |
3.94% |
4.06 |
|
| Comfortable Middle Agers, Mature Home Owning Areas |
16.43% |
13.04% |
126.04 |
|
| Skilled Workers, Home Owning Areas |
27.28% |
12.70% |
214.74 |
|
| New Home Owners, Mature Communities |
10.06% |
8.14% |
123.58 |
|
| White Collar Workers, Better-Off Multi Ethnic Areas |
1.87% |
4.02% |
46.53 |
|
| Older People, Less Prosperous Areas |
2.37% |
3.19% |
74.48 |
|
| Council Estate Residents, Better-Off Homes |
11.73% |
11.31% |
103.72 |
|
| Council Estate Residents, High Unemployment |
0.41% |
3.06% |
13.52 |
|
| Council Estate Residents, Greatest Hardship |
2.16% |
2.52% |
85.63 |
|
| People in Multi-Ethnic, Low-Income Areas |
0.00% |
2.10% |
0.00 |
|
| Unclassified |
0.00% |
0.06% |
0.00 |
|
|
 |
 |
 |
| £0-5K |
8.77% |
9.41% |
93.21 |
|
| £5-10K |
16.69% |
16.63% |
100.32 |
|
| £10-15K |
17.32% |
16.58% |
104.48 |
|
| £15-20K |
14.39% |
13.58% |
105.93 |
|
| £20-25K |
10.96% |
10.39% |
105.42 |
|
| £25-30K |
8.06% |
7.77% |
103.65 |
|
| £30-35K |
5.86% |
5.79% |
101.15 |
|
| £35-40K |
4.26% |
4.33% |
98.25 |
|
| £40-45K |
3.11% |
3.27% |
95.17 |
|
| £45-50K |
2.29% |
2.48% |
92.06 |
|
| £50-55K |
1.70% |
1.90% |
89.02 |
|
| £55-60K |
1.27% |
1.47% |
86.07 |
|
| £60-65K |
0.96% |
1.15% |
83.27 |
|
| £65-70K |
0.73% |
0.91% |
80.62 |
|
| £70-75K |
0.56% |
0.72% |
78.12 |
|
| £75-80K |
0.44% |
0.57% |
75.77 |
|
| £80-85K |
0.34% |
0.46% |
73.57 |
|
| £85-90K |
0.27% |
0.37% |
71.52 |
|
| £90-95K |
0.21% |
0.31% |
69.59 |
|
| £95-100K |
0.17% |
0.25% |
67.79 |
|
| £100K + |
0.79% |
1.34% |
58.90 |
|
|
|

|


|
1992-1997
|
1997-2001
|
|
|
|
| Con |
-12.42% |
| Lab |
16.66% |
| LD |
-8.50% |
|
| Con |
0.15% |
| Lab |
5.24% |
| LD |
-4.16% |
|
|
 |
Derek Wyatt
Labour hold
|
| Con |
 |
13,831 |
36.53% |
| Lab |
 |
17,340 |
45.80% |
| LD |
 |
5,353 |
14.14% |
| Oth |
 |
1,334 |
3.52% |
| Maj |
 |
3,509 |
9.27% |
| Turn |
 |
37,858 |
57.51% |
|
|
 |
Derek Wyatt
Labour hold
|
| C |
Adrian Lee |
13,831 |
36.53% |
| LD |
Elvie Lowe |
5,353 |
14.14% |
| UK |
Robert Oakley |
661 |
1.75% |
| L |
Derek Wyatt |
17,340 |
45.80% |
| RRL |
Michael Young |
673 |
1.78% |
|
Candidates representing 5 parties stood for election to this seat.
|
|
 |
Derek Wyatt
Labour gain
|
| Con |
 |
16,794 |
36.38% |
| Lab |
 |
18,723 |
40.56% |
| LD |
 |
8,447 |
18.30% |
| Ref |
 |
1,082 |
2.34% |
| Oth |
 |
1,116 |
2.42% |
| Maj |
 |
1,929 |
4.18% |
| Turn |
 |
46,162 |
72.30% |
|
|
 |
|
Conservative
|
| Con |
 |
24,669 |
48.80% |
| Lab |
 |
12,106 |
23.90% |
| LD |
 |
13,541 |
26.80% |
| Oth |
 |
236 |
0.50% |
| Maj |
 |
11,128 |
22.00% |
| Turn |
 |
50,552 |
77.60% |
|
|
 |
|

|

