|
Birkenhead
Labour hold

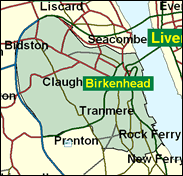
Liverpool's smaller counterpart across the Mersey on the Wirral peninsula, less well known for its dockland tradition but better remembered for its shipbuilding (Cammell Laird, for example), Birkenhead has its own dramatic history and industrial shorescape. As with Liverpool though, this has now become utterly secure in Labour hands, although here too there have been ructions within the party over candidature. Apart from the anomalous Oxton (Liberal Democrat at local Wirral Met Council level), all the wards within the constituency remain massively Labour, and the independently-minded Frank Field, who resigned from the Blair government as social security minister, should have no trouble winning a sixth term here.

Frank Field, an uptight, ascetic, cadaverous bachelor, is one of a clutch of dropped and disaffected Labour ex-ministers. As a Social Security minister for 15 months he was supposed to think the unthinkable on welfare reform, came up with proposals for self-help and compulsory private pensions, and was blocked both by his boss Harriet Harman and by Gordon Brown's Treasury. Born in 1942 and suffering a violent father, he attended Clement Danes Grammar School and Hull University and ran the Child Poverty Action Group until being elected for Birkenhead in 1979, and then spent 12 years fending off would-be Trotskyist deselectors. He is a Germanophobic Eurosceptic and a High Anglican defender of the 1662 Prayer Book.
 |
| Wealthy Achievers, Suburban Areas |
6.00% |
14.99% |
40.04 |
|
| Affluent Greys, Rural Communities |
0.00% |
2.13% |
0.00 |
|
| Prosperous Pensioners, Retirement Areas |
1.74% |
2.49% |
70.10 |
|
| Affluent Executives, Family Areas |
1.06% |
4.43% |
24.02 |
|
| Well-Off Workers, Family Areas |
6.84% |
7.27% |
93.97 |
|
| Affluent Urbanites, Town & City Areas |
1.56% |
2.56% |
60.66 |
|
| Prosperous Professionals, Metropolitan Areas |
0.80% |
2.04% |
39.09 |
|
| Better-Off Executives, Inner City Areas |
6.19% |
3.94% |
156.92 |
|
| Comfortable Middle Agers, Mature Home Owning Areas |
10.05% |
13.04% |
77.11 |
|
| Skilled Workers, Home Owning Areas |
23.69% |
12.70% |
186.46 |
|
| New Home Owners, Mature Communities |
1.85% |
8.14% |
22.75 |
|
| White Collar Workers, Better-Off Multi Ethnic Areas |
3.04% |
4.02% |
75.64 |
|
| Older People, Less Prosperous Areas |
1.99% |
3.19% |
62.58 |
|
| Council Estate Residents, Better-Off Homes |
20.14% |
11.31% |
178.07 |
|
| Council Estate Residents, High Unemployment |
3.92% |
3.06% |
127.93 |
|
| Council Estate Residents, Greatest Hardship |
11.05% |
2.52% |
438.68 |
|
| People in Multi-Ethnic, Low-Income Areas |
0.00% |
2.10% |
0.00 |
|
| Unclassified |
0.08% |
0.06% |
126.81 |
|
|
 |
 |
 |
| £0-5K |
15.92% |
9.41% |
169.12 |
|
| £5-10K |
22.72% |
16.63% |
136.62 |
|
| £10-15K |
18.88% |
16.58% |
113.88 |
|
| £15-20K |
13.23% |
13.58% |
97.42 |
|
| £20-25K |
8.86% |
10.39% |
85.22 |
|
| £25-30K |
5.91% |
7.77% |
76.00 |
|
| £30-35K |
3.99% |
5.79% |
68.88 |
|
| £35-40K |
2.74% |
4.33% |
63.28 |
|
| £40-45K |
1.92% |
3.27% |
58.79 |
|
| £45-50K |
1.37% |
2.48% |
55.14 |
|
| £50-55K |
0.99% |
1.90% |
52.13 |
|
| £55-60K |
0.73% |
1.47% |
49.60 |
|
| £60-65K |
0.55% |
1.15% |
47.46 |
|
| £65-70K |
0.41% |
0.91% |
45.62 |
|
| £70-75K |
0.32% |
0.72% |
44.02 |
|
| £75-80K |
0.25% |
0.57% |
42.63 |
|
| £80-85K |
0.19% |
0.46% |
41.39 |
|
| £85-90K |
0.15% |
0.37% |
40.29 |
|
| £90-95K |
0.12% |
0.31% |
39.30 |
|
| £95-100K |
0.10% |
0.25% |
38.41 |
|
| £100K + |
0.46% |
1.34% |
34.42 |
|
|
|

|


|
1992-1997
|
1997-2001
|
|
|
|
| Con |
-9.89% |
| Lab |
7.16% |
| LD |
-0.68% |
|
| Con |
1.45% |
| Lab |
-0.27% |
| LD |
3.83% |
|
|
 |
Frank Field
Labour hold
|
| Con |
 |
4,827 |
16.66% |
| Lab |
 |
20,418 |
70.49% |
| LD |
 |
3,722 |
12.85% |
| Oth |
|
0 |
0.00% |
| Maj |
 |
15,591 |
53.82% |
| Turn |
 |
28,967 |
47.70% |
|
|
 |
Frank Field
Labour hold
|
| L |
Frank Field |
20,418 |
70.49% |
| C |
Brian Stewart |
4,827 |
16.66% |
| LD |
Roy Wood |
3,722 |
12.85% |
|
Candidates representing 3 parties stood for election to this seat.
|
|
 |
Frank Field
Labour
|
| Con |
 |
5,982 |
15.21% |
| Lab |
 |
27,825 |
70.76% |
| LD |
 |
3,548 |
9.02% |
| Ref |
 |
800 |
2.03% |
| Oth |
 |
1,168 |
2.97% |
| Maj |
 |
21,843 |
55.55% |
| Turn |
 |
39,323 |
65.78% |
|
|
 |
|
Labour
|
| Con |
 |
11,485 |
25.10% |
| Lab |
 |
29,098 |
63.60% |
| LD |
 |
4,417 |
9.70% |
| Oth |
 |
733 |
1.60% |
| Maj |
 |
17,613 |
38.50% |
| Turn |
 |
45,733 |
71.59% |
|
|
 |
|

|

