|
Slough
Labour hold

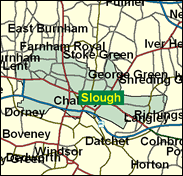
Slough looks the part of a Labour stronghold, with its famed industrial buildings along the Great West Road which prompted the architecture loving traditionalist John Betjeman to call for "come friendly bombs . . . " , and also it large Asian community in the centre of town; but this is the south east, and Slough has often been included in a Conservative seat, bizarrely coupled with the elite name of Eton until 1983, and it was after a long hiatus that Fiona MacTaggart won the seat convincingly in 1997; it is reckoned it would have been a photo-finish if the current boundaries had existed in 1992. It seems safe for Labour now though; they were still 20pc ahead of the Tories in the all-out unitary authority in the May 1999 midterm.

Fiona MacTaggart, PPS to Culture Secretary Chris Smith, was elected in 1997 after selection from an all-women shortlist. The granddaughter of a Conservative MP, born 1953 and educated at Cheltenham Ladies College and King's College London, she has worked as a primary school teacher and lecturer in education, though is rich enough not to need to. Big, strapping and extrovert and with a background as a councillor in the highly polarised Wandsworth Council, she campaigns on local health and immigration issues, and is mildly Eurosceptic.
 |
| Wealthy Achievers, Suburban Areas |
5.40% |
14.99% |
36.00 |
|
| Affluent Greys, Rural Communities |
0.40% |
2.13% |
18.59 |
|
| Prosperous Pensioners, Retirement Areas |
0.44% |
2.49% |
17.80 |
|
| Affluent Executives, Family Areas |
2.62% |
4.43% |
59.28 |
|
| Well-Off Workers, Family Areas |
6.46% |
7.27% |
88.82 |
|
| Affluent Urbanites, Town & City Areas |
11.29% |
2.56% |
440.05 |
|
| Prosperous Professionals, Metropolitan Areas |
0.00% |
2.04% |
0.00 |
|
| Better-Off Executives, Inner City Areas |
2.02% |
3.94% |
51.11 |
|
| Comfortable Middle Agers, Mature Home Owning Areas |
6.16% |
13.04% |
47.22 |
|
| Skilled Workers, Home Owning Areas |
12.11% |
12.70% |
95.34 |
|
| New Home Owners, Mature Communities |
6.43% |
8.14% |
78.96 |
|
| White Collar Workers, Better-Off Multi Ethnic Areas |
7.44% |
4.02% |
185.03 |
|
| Older People, Less Prosperous Areas |
5.66% |
3.19% |
177.62 |
|
| Council Estate Residents, Better-Off Homes |
14.48% |
11.31% |
127.99 |
|
| Council Estate Residents, High Unemployment |
1.27% |
3.06% |
41.62 |
|
| Council Estate Residents, Greatest Hardship |
1.65% |
2.52% |
65.51 |
|
| People in Multi-Ethnic, Low-Income Areas |
16.18% |
2.10% |
770.58 |
|
| Unclassified |
0.00% |
0.06% |
0.00 |
|
|
 |
 |
 |
| £0-5K |
5.44% |
9.41% |
57.82 |
|
| £5-10K |
12.20% |
16.63% |
73.32 |
|
| £10-15K |
14.77% |
16.58% |
89.08 |
|
| £15-20K |
13.95% |
13.58% |
102.67 |
|
| £20-25K |
11.77% |
10.39% |
113.27 |
|
| £25-30K |
9.40% |
7.77% |
120.97 |
|
| £30-35K |
7.31% |
5.79% |
126.20 |
|
| £35-40K |
5.61% |
4.33% |
129.46 |
|
| £40-45K |
4.28% |
3.27% |
131.21 |
|
| £45-50K |
3.27% |
2.48% |
131.83 |
|
| £50-55K |
2.51% |
1.90% |
131.65 |
|
| £55-60K |
1.93% |
1.47% |
130.87 |
|
| £60-65K |
1.49% |
1.15% |
129.69 |
|
| £65-70K |
1.16% |
0.91% |
128.22 |
|
| £70-75K |
0.91% |
0.72% |
126.57 |
|
| £75-80K |
0.72% |
0.57% |
124.80 |
|
| £80-85K |
0.57% |
0.46% |
122.97 |
|
| £85-90K |
0.45% |
0.37% |
121.10 |
|
| £90-95K |
0.36% |
0.31% |
119.24 |
|
| £95-100K |
0.29% |
0.25% |
117.38 |
|
| £100K + |
1.43% |
1.34% |
106.07 |
|
|
|

|


|
1992-1997
|
1997-2001
|
|
|
|
| Con |
-14.76% |
| Lab |
12.53% |
| LD |
0.15% |
|
| Con |
-3.06% |
| Lab |
1.63% |
| LD |
3.18% |
|
|
 |
Fiona Mactaggart
Labour hold
|
| Con |
 |
10,210 |
26.18% |
| Lab |
 |
22,718 |
58.25% |
| LD |
 |
4,109 |
10.54% |
| Oth |
 |
1,961 |
5.03% |
| Maj |
 |
12,508 |
32.07% |
| Turn |
 |
38,998 |
53.84% |
|
|
 |
Fiona Mactaggart
Labour hold
|
| C |
Diana Coad |
10,210 |
26.18% |
| Ind H |
Michael Haines |
859 |
2.20% |
| LD |
Keith Kerr |
4,109 |
10.54% |
| UK |
John Lane |
738 |
1.89% |
| L |
Fiona Mactaggart |
22,718 |
58.25% |
| Ind N |
Choudry Nazir |
364 |
0.93% |
|
Candidates representing 6 parties stood for election to this seat.
|
|
 |
Fiona Mactaggart
Labour
|
| Con |
 |
13,958 |
29.24% |
| Lab |
 |
27,029 |
56.63% |
| LD |
 |
3,509 |
7.35% |
| Ref |
 |
1,124 |
2.35% |
| Oth |
 |
2,112 |
4.42% |
| Maj |
 |
13,071 |
27.38% |
| Turn |
 |
47,732 |
67.91% |
|
|
 |
|
Labour
|
| Con |
 |
23,544 |
44.00% |
| Lab |
 |
23,580 |
44.10% |
| LD |
 |
3,841 |
7.20% |
| Oth |
 |
2,500 |
4.70% |
| Maj |
 |
36 |
0.10% |
| Turn |
 |
53,465 |
76.98% |
|
|
 |
|

|

