|
Solihull
Conservative hold

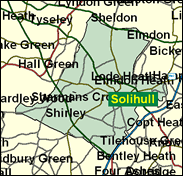
Although Solihull no longer reports Conservative majorities of 32,000 as it did in 1979, it is still one of the safest Tory seats in the country. Like Sutton Coldfield, it is a middle-class, almost all white, bloc on the eastern edge of Birmingham, although unlike Sutton it has its own Metropolitan Borough (which also includes Meriden constituency) named after it, rather than being subsumed into the mother city. It is the home of many white collar managerial types in Birmingham's immense variety of industry and commerce, diversified enough to withstand slumps and benefit from booms such as that of the past few years, and it has shown no serious inclination at any point in local or general elections to turn its favours even as a protest to the Liberal Democrats or Labour. Even the car factory here was that of Rover which (hard though it may be to remember such a day) considered itself a cut above its West Midlands rivals.

John (Mark) Taylor, a Conservative Northern Ireland spokesman, has been MP here since 1983. An affable pudgy-faced solicitor, born 1941 and educated at Bromsgrove School and a law college, he has risen without trace through a series of posts since first entering the Government Whips Office in 1988. With a reputation as a Groucho Marx impersonator, he is also numbered amongst the Tory minority that votes to ban fox hunting.
 |
| Wealthy Achievers, Suburban Areas |
33.64% |
14.99% |
224.38 |
|
| Affluent Greys, Rural Communities |
0.00% |
2.13% |
0.00 |
|
| Prosperous Pensioners, Retirement Areas |
2.62% |
2.49% |
105.33 |
|
| Affluent Executives, Family Areas |
7.08% |
4.43% |
160.05 |
|
| Well-Off Workers, Family Areas |
7.33% |
7.27% |
100.76 |
|
| Affluent Urbanites, Town & City Areas |
1.18% |
2.56% |
46.17 |
|
| Prosperous Professionals, Metropolitan Areas |
0.33% |
2.04% |
16.10 |
|
| Better-Off Executives, Inner City Areas |
0.00% |
3.94% |
0.00 |
|
| Comfortable Middle Agers, Mature Home Owning Areas |
34.70% |
13.04% |
266.11 |
|
| Skilled Workers, Home Owning Areas |
2.37% |
12.70% |
18.63 |
|
| New Home Owners, Mature Communities |
6.16% |
8.14% |
75.61 |
|
| White Collar Workers, Better-Off Multi Ethnic Areas |
0.00% |
4.02% |
0.00 |
|
| Older People, Less Prosperous Areas |
2.84% |
3.19% |
89.27 |
|
| Council Estate Residents, Better-Off Homes |
1.25% |
11.31% |
11.04 |
|
| Council Estate Residents, High Unemployment |
0.50% |
3.06% |
16.40 |
|
| Council Estate Residents, Greatest Hardship |
0.00% |
2.52% |
0.00 |
|
| People in Multi-Ethnic, Low-Income Areas |
0.00% |
2.10% |
0.00 |
|
| Unclassified |
0.00% |
0.06% |
0.00 |
|
|
 |
 |
 |
| £0-5K |
6.24% |
9.41% |
66.32 |
|
| £5-10K |
12.33% |
16.63% |
74.11 |
|
| £10-15K |
14.01% |
16.58% |
84.52 |
|
| £15-20K |
12.88% |
13.58% |
94.83 |
|
| £20-25K |
10.85% |
10.39% |
104.36 |
|
| £25-30K |
8.78% |
7.77% |
112.95 |
|
| £30-35K |
6.99% |
5.79% |
120.62 |
|
| £35-40K |
5.52% |
4.33% |
127.40 |
|
| £40-45K |
4.36% |
3.27% |
133.39 |
|
| £45-50K |
3.44% |
2.48% |
138.66 |
|
| £50-55K |
2.73% |
1.90% |
143.28 |
|
| £55-60K |
2.17% |
1.47% |
147.32 |
|
| £60-65K |
1.74% |
1.15% |
150.84 |
|
| £65-70K |
1.40% |
0.91% |
153.91 |
|
| £70-75K |
1.13% |
0.72% |
156.56 |
|
| £75-80K |
0.91% |
0.57% |
158.85 |
|
| £80-85K |
0.74% |
0.46% |
160.81 |
|
| £85-90K |
0.61% |
0.37% |
162.48 |
|
| £90-95K |
0.50% |
0.31% |
163.89 |
|
| £95-100K |
0.41% |
0.25% |
165.08 |
|
| £100K + |
2.25% |
1.34% |
167.11 |
|
|
|

|


|
1992-1997
|
1997-2001
|
|
|
|
| Con |
-16.15% |
| Lab |
7.63% |
| LD |
4.30% |
|
| Con |
0.80% |
| Lab |
1.30% |
| LD |
0.66% |
|
|
 |
John Taylor
Conservative hold
|
| Con |
 |
21,935 |
45.44% |
| Lab |
 |
12,373 |
25.63% |
| LD |
 |
12,528 |
25.95% |
| Oth |
 |
1,435 |
2.97% |
| Maj |
 |
9,407 |
19.49% |
| Turn |
 |
48,271 |
62.61% |
|
|
 |
John Taylor
Conservative hold
|
| LD |
Jo Byron |
12,528 |
25.95% |
| UK |
Andy Moore |
1,061 |
2.20% |
| L |
Brendan O'Brien |
12,373 |
25.63% |
| P |
Stephanie Pyne |
374 |
0.77% |
| C |
John Taylor |
21,935 |
45.44% |
|
Candidates representing 5 parties stood for election to this seat.
|
|
 |
John Taylor
Conservative
|
| Con |
 |
26,299 |
44.65% |
| Lab |
 |
14,334 |
24.33% |
| LD |
 |
14,902 |
25.30% |
| Ref |
 |
2,748 |
4.67% |
| Oth |
 |
623 |
1.06% |
| Maj |
 |
11,397 |
19.35% |
| Turn |
 |
58,906 |
74.66% |
|
|
 |
|
Conservative
|
| Con |
 |
38,277 |
60.80% |
| Lab |
 |
10,512 |
16.70% |
| LD |
 |
13,202 |
21.00% |
| Oth |
 |
925 |
1.50% |
| Maj |
 |
25,075 |
39.90% |
| Turn |
 |
62,916 |
80.49% |
|
|
 |
|

|

