|
Somerton & Frome
Liberal Democrat hold

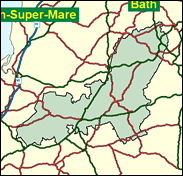
The Liberal Democrats only won this east Somerset seat by a slender margin in 1997 (130 votes) in circumstances so nationally dramatic that one is actually surprised it wasn't more locally convincing. Together with patchy showings in the most recent local elections in the Districts of Mendip and South Somerset, and the 26 point Tory lead in the 1999 Euro elections, there is a considerable body of evidence building up that Somerton and Frome may actually be one of the Lib Dems' weakest seats to defend when the next general election comes, especially with polling evidence as late as April 2001 suggesting a Tory recovery in the more rural parts of England, fired perhaps by the perceived embattlement of the countryside under a New Labour government.

David Heath, a Liberal Democrat Agriculture spokesman, was elected here in 1997. A black-bearded optician from Frome who led Somerset County Council for four years, he was born in 1954 and educated as a scholarship boy at Millfield School and at St John's College Oxford (as a contemporary of Tony Blair). Sensitive to a rural economy in crisis, he votes very cautiously on hunting, recently backing 'licensing' of hunts and abstaining in the vote on abolition. High Tory hopes here rest with Jonathan Marland, born 1956, who after Shrewsbury and Oxford Polytechnic, worked in insurance with Willis Faber, and latterly Jardine Lloyd Thompson. In 1998 he established the Conservative Business Liaison Unit to restore links between the Party and business.
 |
| Wealthy Achievers, Suburban Areas |
24.27% |
14.99% |
161.88 |
|
| Affluent Greys, Rural Communities |
7.69% |
2.13% |
361.77 |
|
| Prosperous Pensioners, Retirement Areas |
0.91% |
2.49% |
36.71 |
|
| Affluent Executives, Family Areas |
2.16% |
4.43% |
48.91 |
|
| Well-Off Workers, Family Areas |
6.58% |
7.27% |
90.43 |
|
| Affluent Urbanites, Town & City Areas |
0.23% |
2.56% |
9.05 |
|
| Prosperous Professionals, Metropolitan Areas |
0.00% |
2.04% |
0.00 |
|
| Better-Off Executives, Inner City Areas |
0.13% |
3.94% |
3.19 |
|
| Comfortable Middle Agers, Mature Home Owning Areas |
25.93% |
13.04% |
198.87 |
|
| Skilled Workers, Home Owning Areas |
11.05% |
12.70% |
86.98 |
|
| New Home Owners, Mature Communities |
12.06% |
8.14% |
148.15 |
|
| White Collar Workers, Better-Off Multi Ethnic Areas |
2.39% |
4.02% |
59.49 |
|
| Older People, Less Prosperous Areas |
2.40% |
3.19% |
75.33 |
|
| Council Estate Residents, Better-Off Homes |
3.94% |
11.31% |
34.87 |
|
| Council Estate Residents, High Unemployment |
0.00% |
3.06% |
0.00 |
|
| Council Estate Residents, Greatest Hardship |
0.08% |
2.52% |
2.99 |
|
| People in Multi-Ethnic, Low-Income Areas |
0.00% |
2.10% |
0.00 |
|
| Unclassified |
0.17% |
0.06% |
269.29 |
|
|
 |
 |
 |
| £0-5K |
8.91% |
9.41% |
94.60 |
|
| £5-10K |
16.59% |
16.63% |
99.76 |
|
| £10-15K |
17.21% |
16.58% |
103.78 |
|
| £15-20K |
14.36% |
13.58% |
105.71 |
|
| £20-25K |
11.00% |
10.39% |
105.88 |
|
| £25-30K |
8.15% |
7.77% |
104.80 |
|
| £30-35K |
5.96% |
5.79% |
102.91 |
|
| £35-40K |
4.36% |
4.33% |
100.52 |
|
| £40-45K |
3.19% |
3.27% |
97.85 |
|
| £45-50K |
2.36% |
2.48% |
95.06 |
|
| £50-55K |
1.76% |
1.90% |
92.24 |
|
| £55-60K |
1.32% |
1.47% |
89.45 |
|
| £60-65K |
1.00% |
1.15% |
86.75 |
|
| £65-70K |
0.76% |
0.91% |
84.14 |
|
| £70-75K |
0.59% |
0.72% |
81.65 |
|
| £75-80K |
0.46% |
0.57% |
79.28 |
|
| £80-85K |
0.36% |
0.46% |
77.04 |
|
| £85-90K |
0.28% |
0.37% |
74.91 |
|
| £90-95K |
0.22% |
0.31% |
72.90 |
|
| £95-100K |
0.18% |
0.25% |
71.00 |
|
| £100K + |
0.82% |
1.34% |
61.34 |
|
|
|

|


|
1992-1997
|
1997-2001
|
|
|
|
| Con |
-8.11% |
| Lab |
5.95% |
| LD |
-0.78% |
|
| Con |
3.07% |
| Lab |
-4.75% |
| LD |
4.11% |
|
|
 |
David Heath
Liberal Democrat hold
|
| Con |
 |
22,315 |
42.36% |
| Lab |
 |
6,113 |
11.60% |
| LD |
 |
22,983 |
43.62% |
| Oth |
 |
1,273 |
2.42% |
| Maj |
 |
668 |
1.27% |
| Turn |
 |
52,684 |
70.25% |
|
|
 |
David Heath
Liberal Democrat hold
|
| UK |
Peter Bridgewood |
919 |
1.74% |
| LD |
David Heath |
22,983 |
43.62% |
| L |
Jonathan Marland |
6,113 |
11.60% |
| C |
Andrew Perkins |
22,315 |
42.36% |
| LB |
Jean Pollock |
354 |
0.67% |
|
Candidates representing 5 parties stood for election to this seat.
|
|
 |
David Heath
Liberal Democrat gain
|
| Con |
 |
22,554 |
39.29% |
| Lab |
 |
9,385 |
16.35% |
| LD |
 |
22,684 |
39.52% |
| Ref |
 |
2,449 |
4.27% |
| Oth |
 |
331 |
0.58% |
| Maj |
 |
130 |
0.23% |
| Turn |
 |
57,403 |
77.58% |
|
|
 |
|
Conservative
|
| Con |
 |
28,287 |
47.40% |
| Lab |
 |
6,217 |
10.40% |
| LD |
 |
24,036 |
40.30% |
| Oth |
 |
1,132 |
1.90% |
| Maj |
 |
4,251 |
7.10% |
| Turn |
 |
59,672 |
82.26% |
|
|
 |
|

|

