|
South Holland & The Deepings
Conservative hold

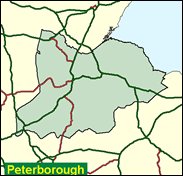
Fenlands is deep and mysterious country (read Grahan Swift's eerie novel, Waterland). The name of the former Parts of Holland implies that the flat farmland here in south east Lincolnshire is reminiscent of the Netherlands, needing drainage and situated between the deep slow flowing Nene and Welland rivers and fringing the muddy Wash. There are vast open skies and fields of flowers as well as vegetables beneath vast and moody skies - very un-English scenery. The Liberal Democrats are very weak for so rural an area, and although Labour occasionally challenged in Holland with Boston constituency, Boston has now departed to be paired with Skegness and the largest town is the watery and flowery Spalding. Labour will find it hard to locate the mountain they need to climb to win in this landscape, still less to ascend it.

John Hayes, an Education & Employment spokesman, was elected in 1997 and joined the Agriculture Select Committee as MP for the second most agricultural seat in England. A Redwood, then Hague, supporter in 1997, he opposes devolution and English regionalism, the Euro, PR and as a meritocratic working class grammar school boy (born 1958 and educated at Colfe's, Lewisham) who got to Nottingham University, defends grammar schools. With lop-sided facial features redolent of Asa Briggs, he was formerly a computer company sales director, but presciently for a computer buff, observed in 1999 that 'information' does not equal 'wisdom.'
 |
| Wealthy Achievers, Suburban Areas |
13.89% |
14.99% |
92.64 |
|
| Affluent Greys, Rural Communities |
13.58% |
2.13% |
638.49 |
|
| Prosperous Pensioners, Retirement Areas |
4.45% |
2.49% |
179.11 |
|
| Affluent Executives, Family Areas |
7.27% |
4.43% |
164.31 |
|
| Well-Off Workers, Family Areas |
4.07% |
7.27% |
55.89 |
|
| Affluent Urbanites, Town & City Areas |
0.09% |
2.56% |
3.37 |
|
| Prosperous Professionals, Metropolitan Areas |
0.00% |
2.04% |
0.00 |
|
| Better-Off Executives, Inner City Areas |
0.09% |
3.94% |
2.22 |
|
| Comfortable Middle Agers, Mature Home Owning Areas |
37.22% |
13.04% |
285.48 |
|
| Skilled Workers, Home Owning Areas |
6.21% |
12.70% |
48.92 |
|
| New Home Owners, Mature Communities |
9.73% |
8.14% |
119.46 |
|
| White Collar Workers, Better-Off Multi Ethnic Areas |
0.61% |
4.02% |
15.28 |
|
| Older People, Less Prosperous Areas |
1.65% |
3.19% |
51.94 |
|
| Council Estate Residents, Better-Off Homes |
0.33% |
11.31% |
2.95 |
|
| Council Estate Residents, High Unemployment |
0.31% |
3.06% |
10.09 |
|
| Council Estate Residents, Greatest Hardship |
0.49% |
2.52% |
19.60 |
|
| People in Multi-Ethnic, Low-Income Areas |
0.00% |
2.10% |
0.00 |
|
| Unclassified |
0.00% |
0.06% |
0.00 |
|
|
 |
 |
 |
| £0-5K |
8.52% |
9.41% |
90.55 |
|
| £5-10K |
17.26% |
16.63% |
103.76 |
|
| £10-15K |
18.02% |
16.58% |
108.72 |
|
| £15-20K |
14.84% |
13.58% |
109.24 |
|
| £20-25K |
11.14% |
10.39% |
107.19 |
|
| £25-30K |
8.06% |
7.77% |
103.70 |
|
| £30-35K |
5.76% |
5.79% |
99.51 |
|
| £35-40K |
4.12% |
4.33% |
95.04 |
|
| £40-45K |
2.96% |
3.27% |
90.57 |
|
| £45-50K |
2.14% |
2.48% |
86.25 |
|
| £50-55K |
1.56% |
1.90% |
82.16 |
|
| £55-60K |
1.15% |
1.47% |
78.34 |
|
| £60-65K |
0.86% |
1.15% |
74.80 |
|
| £65-70K |
0.65% |
0.91% |
71.53 |
|
| £70-75K |
0.49% |
0.72% |
68.53 |
|
| £75-80K |
0.38% |
0.57% |
65.78 |
|
| £80-85K |
0.29% |
0.46% |
63.25 |
|
| £85-90K |
0.23% |
0.37% |
60.93 |
|
| £90-95K |
0.18% |
0.31% |
58.80 |
|
| £95-100K |
0.14% |
0.25% |
56.83 |
|
| £100K + |
0.64% |
1.34% |
47.78 |
|
|
|

|


|
1992-1997
|
1997-2001
|
|
|
|
| Con |
-7.75% |
| Lab |
9.21% |
| LD |
-3.27% |
|
| Con |
6.18% |
| Lab |
-1.90% |
| LD |
-5.33% |
|
|
 |
John Hayes
Conservative hold
|
| Con |
 |
25,611 |
55.43% |
| Lab |
 |
14,512 |
31.41% |
| LD |
 |
4,761 |
10.30% |
| Oth |
 |
1,318 |
2.85% |
| Maj |
 |
11,099 |
24.02% |
| Turn |
 |
46,202 |
62.54% |
|
|
 |
John Hayes
Conservative hold
|
| UK |
Malcolm Charlesworth |
1,318 |
2.85% |
| C |
John Hayes |
25,611 |
55.43% |
| LD |
Grace Hill |
4,761 |
10.30% |
| L |
Graham Walker |
14,512 |
31.41% |
|
Candidates representing 4 parties stood for election to this seat.
|
|
 |
John Hayes
Conservative
|
| Con |
 |
24,691 |
49.25% |
| Lab |
 |
16,700 |
33.31% |
| LD |
 |
7,836 |
15.63% |
| Ref |
|
0 |
0.00% |
| Oth |
 |
902 |
1.80% |
| Maj |
 |
7,991 |
15.94% |
| Turn |
 |
50,129 |
71.98% |
|
|
 |
|
Conservative
|
| Con |
 |
29,017 |
57.00% |
| Lab |
 |
12,254 |
24.10% |
| LD |
 |
9,619 |
18.90% |
| Oth |
|
0 |
0.00% |
| Maj |
 |
16,763 |
32.90% |
| Turn |
 |
50,890 |
79.21% |
|
|
 |
|

|

