|
South Shields
Labour hold

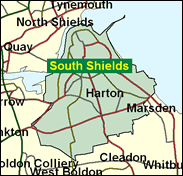
The self-contained South Tyneside port town of South Shields is a gritty and working class corner of the land, as the enlightening and sobering statistics demonstrate. With well over half of its households earning less than £15,000 a year - how far would that go in Surrey Heath or Sussex Mid? - it is not surprising that 57 per cent of its people live in ACORN ("A Classification of Residential Neighbourhoods") categories summed up as "striving". Struggling might be a less positively expressed term. Nearly nine per cent find themsleves grouped as "council estate residents, greatest hardship", one of the highest figures for England. It is scarcely surprising, then, that the precocious chief of of the Blair No 10 Policy Unit, first-class PPE Oxford graduate, and ace all-round village cricketer David Milliband should become the Labour candidate. One unusual group which even the perceptive ACORN method does not pick up is a long-established is small Yemeni community, which has found its way to these climes so unlike that of the corner of Arabia on the Red Sea and the Indian Ocean.

David Miliband was neatly inserted here during the first week of the campaign in succession to the obligingly late-retiring MP David Clark. From the core of the Blairite inner circle, he has run the Downing Street Policy Unit since 1997 and before that headed Blair's office in Opposition. Co-author of the 1997 Manifesto, if seen as stronger on ideas than presentation, he was born in 1965 and educated at Haverstock Comprehensive, Corpus Christi, Oxford and MIT. Ideologically somewhat displaced from his family of origin, his father, the late marxist academic Ralph Miliband, would doubtless have been as concerned about
David's book "Reinventing the Left", as he was oddly surprised about the lack of socialism from Labour governments, as recounted in his own book, "Parliamentary Socialism".
 |
| Wealthy Achievers, Suburban Areas |
3.41% |
14.99% |
22.74 |
|
| Affluent Greys, Rural Communities |
0.00% |
2.13% |
0.00 |
|
| Prosperous Pensioners, Retirement Areas |
0.13% |
2.49% |
5.38 |
|
| Affluent Executives, Family Areas |
0.45% |
4.43% |
10.15 |
|
| Well-Off Workers, Family Areas |
3.10% |
7.27% |
42.56 |
|
| Affluent Urbanites, Town & City Areas |
2.25% |
2.56% |
87.88 |
|
| Prosperous Professionals, Metropolitan Areas |
0.43% |
2.04% |
21.16 |
|
| Better-Off Executives, Inner City Areas |
1.31% |
3.94% |
33.11 |
|
| Comfortable Middle Agers, Mature Home Owning Areas |
8.68% |
13.04% |
66.59 |
|
| Skilled Workers, Home Owning Areas |
8.06% |
12.70% |
63.44 |
|
| New Home Owners, Mature Communities |
14.20% |
8.14% |
174.35 |
|
| White Collar Workers, Better-Off Multi Ethnic Areas |
1.60% |
4.02% |
39.67 |
|
| Older People, Less Prosperous Areas |
13.07% |
3.19% |
410.18 |
|
| Council Estate Residents, Better-Off Homes |
27.81% |
11.31% |
245.86 |
|
| Council Estate Residents, High Unemployment |
6.72% |
3.06% |
219.60 |
|
| Council Estate Residents, Greatest Hardship |
8.79% |
2.52% |
348.92 |
|
| People in Multi-Ethnic, Low-Income Areas |
0.00% |
2.10% |
0.00 |
|
| Unclassified |
0.00% |
0.06% |
0.00 |
|
|
 |
 |
 |
| £0-5K |
15.38% |
9.41% |
163.38 |
|
| £5-10K |
22.74% |
16.63% |
136.72 |
|
| £10-15K |
19.14% |
16.58% |
115.45 |
|
| £15-20K |
13.51% |
13.58% |
99.46 |
|
| £20-25K |
9.07% |
10.39% |
87.28 |
|
| £25-30K |
6.05% |
7.77% |
77.77 |
|
| £30-35K |
4.06% |
5.79% |
70.18 |
|
| £35-40K |
2.77% |
4.33% |
64.00 |
|
| £40-45K |
1.92% |
3.27% |
58.91 |
|
| £45-50K |
1.36% |
2.48% |
54.65 |
|
| £50-55K |
0.97% |
1.90% |
51.05 |
|
| £55-60K |
0.71% |
1.47% |
47.97 |
|
| £60-65K |
0.52% |
1.15% |
45.31 |
|
| £65-70K |
0.39% |
0.91% |
43.00 |
|
| £70-75K |
0.29% |
0.72% |
40.97 |
|
| £75-80K |
0.23% |
0.57% |
39.18 |
|
| £80-85K |
0.17% |
0.46% |
37.59 |
|
| £85-90K |
0.14% |
0.37% |
36.17 |
|
| £90-95K |
0.11% |
0.31% |
34.89 |
|
| £95-100K |
0.08% |
0.25% |
33.74 |
|
| £100K + |
0.38% |
1.34% |
28.57 |
|
|
|

|


|
1992-1997
|
1997-2001
|
|
|
|
| Con |
-12.03% |
| Lab |
10.31% |
| LD |
-3.50% |
|
| Con |
2.31% |
| Lab |
-8.25% |
| LD |
8.04% |
|
|
 |
David Miliband
Labour hold
|
| Con |
 |
5,140 |
16.88% |
| Lab |
 |
19,230 |
63.16% |
| LD |
 |
5,127 |
16.84% |
| Oth |
 |
951 |
3.12% |
| Maj |
 |
14,090 |
46.28% |
| Turn |
 |
30,448 |
49.27% |
|
|
 |
David Miliband
Labour hold
|
| C |
Joanna Gardner |
5,140 |
16.88% |
| LD |
Marshall Grainger |
5,127 |
16.84% |
| UK |
Alan Hardy |
689 |
2.26% |
| L |
David Miliband |
19,230 |
63.16% |
| I |
Roger Nettleship |
262 |
0.86% |
|
Candidates representing 5 parties stood for election to this seat.
|
|
 |
David Clark
Labour
|
| Con |
 |
5,681 |
14.57% |
| Lab |
 |
27,834 |
71.41% |
| LD |
 |
3,429 |
8.80% |
| Ref |
 |
1,660 |
4.26% |
| Oth |
 |
374 |
0.96% |
| Maj |
 |
22,153 |
56.83% |
| Turn |
 |
38,978 |
62.60% |
|
|
 |
|
Labour
|
| Con |
 |
12,220 |
26.60% |
| Lab |
 |
28,041 |
61.10% |
| LD |
 |
5,626 |
12.30% |
| Oth |
|
0 |
0.00% |
| Maj |
 |
15,821 |
34.50% |
| Turn |
 |
45,887 |
69.67% |
|
|
 |
|

|

