|
Southampton, Itchen
Labour hold

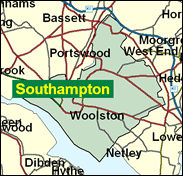
Both Southampton seats, though historically critical marginals which played a role in determining the identity of the government of the United Kingdom, must now be regarded as safely Labour in general elections, although the Liberal Democrats perform well in unitary authority elections within the city. This is still a two-party contest at national level, and Labour holds the whip hand - for the time being. Itchen is essentially the eastern half of Southampton, straddling the river whose name it bears, to include neighbourhoods such as Bitterne and Bitterne Park, Woolston, Harefield and Peartree, mixed suburban territory of respectable council estates and lower middle class owner occupiers, along with the heavily redeveloped city centre and the Ocean Village marina area. Itchen was the first of the Southampton seats to fall to Labour, and indeed returned the first ever Labour Speaker of the House of Commons, the former headmaster Dr Horace King - which must be one of this area's greatest and most enduring claims to fame.

John Denham, Minister of State for Health, was elected third-time-lucky here in 1992, as a former Southampton-based city and county councillor. A one-time unilateralist opponent of Trident and Cruise and proponent of "extra-parliamentary action" to achieve a "democratic socialist society", by 1994 he was apologizing for the factionalism of the 1980s, and as part of Labour's 'Southern strategy' to revive electorally in the south of England, urging the party to acknowledge that nowadays 'ten times as many people sell insurance as dig coal.' Born 1953 and educated at Woodroffe Comprehensive, Lyme Regis and Southampton University, he worked originally for a raft of voluntary sector organisations (War on Want, Friends of the Earth, the British Youth Council), was quickly onto the front bench by 1995 and into government in 1997 as a pensions specialist, where his suit and switched-on rictus make him a model Blairite minister.
 |
| Wealthy Achievers, Suburban Areas |
4.15% |
14.99% |
27.71 |
|
| Affluent Greys, Rural Communities |
0.00% |
2.13% |
0.00 |
|
| Prosperous Pensioners, Retirement Areas |
1.93% |
2.49% |
77.48 |
|
| Affluent Executives, Family Areas |
0.64% |
4.43% |
14.37 |
|
| Well-Off Workers, Family Areas |
4.24% |
7.27% |
58.34 |
|
| Affluent Urbanites, Town & City Areas |
2.34% |
2.56% |
91.08 |
|
| Prosperous Professionals, Metropolitan Areas |
0.00% |
2.04% |
0.00 |
|
| Better-Off Executives, Inner City Areas |
4.96% |
3.94% |
125.80 |
|
| Comfortable Middle Agers, Mature Home Owning Areas |
25.85% |
13.04% |
198.27 |
|
| Skilled Workers, Home Owning Areas |
10.77% |
12.70% |
84.76 |
|
| New Home Owners, Mature Communities |
9.83% |
8.14% |
120.73 |
|
| White Collar Workers, Better-Off Multi Ethnic Areas |
2.27% |
4.02% |
56.38 |
|
| Older People, Less Prosperous Areas |
6.38% |
3.19% |
200.34 |
|
| Council Estate Residents, Better-Off Homes |
15.01% |
11.31% |
132.66 |
|
| Council Estate Residents, High Unemployment |
8.19% |
3.06% |
267.48 |
|
| Council Estate Residents, Greatest Hardship |
1.45% |
2.52% |
57.70 |
|
| People in Multi-Ethnic, Low-Income Areas |
1.99% |
2.10% |
94.63 |
|
| Unclassified |
0.01% |
0.06% |
11.00 |
|
|
 |
 |
 |
| £0-5K |
11.82% |
9.41% |
125.61 |
|
| £5-10K |
19.98% |
16.63% |
120.14 |
|
| £10-15K |
18.79% |
16.58% |
113.31 |
|
| £15-20K |
14.38% |
13.58% |
105.89 |
|
| £20-25K |
10.24% |
10.39% |
98.50 |
|
| £25-30K |
7.11% |
7.77% |
91.46 |
|
| £30-35K |
4.92% |
5.79% |
84.93 |
|
| £35-40K |
3.42% |
4.33% |
78.97 |
|
| £40-45K |
2.40% |
3.27% |
73.57 |
|
| £45-50K |
1.71% |
2.48% |
68.70 |
|
| £50-55K |
1.22% |
1.90% |
64.31 |
|
| £55-60K |
0.89% |
1.47% |
60.35 |
|
| £60-65K |
0.65% |
1.15% |
56.78 |
|
| £65-70K |
0.49% |
0.91% |
53.56 |
|
| £70-75K |
0.36% |
0.72% |
50.64 |
|
| £75-80K |
0.28% |
0.57% |
47.98 |
|
| £80-85K |
0.21% |
0.46% |
45.57 |
|
| £85-90K |
0.16% |
0.37% |
43.36 |
|
| £90-95K |
0.13% |
0.31% |
41.35 |
|
| £95-100K |
0.10% |
0.25% |
39.50 |
|
| £100K + |
0.42% |
1.34% |
31.04 |
|
|
|

|


|
1992-1997
|
1997-2001
|
|
|
|
| Con |
-13.71% |
| Lab |
10.77% |
| LD |
-2.22% |
|
| Con |
-1.00% |
| Lab |
-0.26% |
| LD |
3.30% |
|
|
 |
John Denham
Labour hold
|
| Con |
 |
11,330 |
27.39% |
| Lab |
 |
22,553 |
54.51% |
| LD |
 |
6,195 |
14.97% |
| Oth |
 |
1,295 |
3.13% |
| Maj |
 |
11,223 |
27.13% |
| Turn |
 |
41,373 |
54.01% |
|
|
 |
John Denham
Labour hold
|
| LD |
Mark Cooper |
6,195 |
14.97% |
| L |
John Denham |
22,553 |
54.51% |
| SL |
Michael Holmes |
225 |
0.54% |
| SA |
Gavin Marsh |
241 |
0.58% |
| C |
Caroline Noakes |
11,330 |
27.39% |
| UK |
Kim Rose |
829 |
2.00% |
|
Candidates representing 6 parties stood for election to this seat.
|
|
 |
John Denham
Labour
|
| Con |
 |
15,289 |
28.39% |
| Lab |
 |
29,498 |
54.77% |
| LD |
 |
6,289 |
11.68% |
| Ref |
 |
1,660 |
3.08% |
| Oth |
 |
1,122 |
2.08% |
| Maj |
 |
14,209 |
26.38% |
| Turn |
 |
53,858 |
70.06% |
|
|
 |
|
Labour
|
| Con |
 |
24,065 |
42.10% |
| Lab |
 |
25,118 |
44.00% |
| LD |
 |
7,924 |
13.90% |
| Oth |
|
0 |
0.00% |
| Maj |
 |
1,053 |
1.80% |
| Turn |
 |
57,107 |
77.49% |
|
|
 |
|

|

