|
Southampton, Test
Labour hold

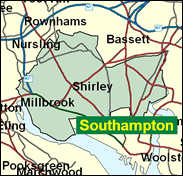
From 1945 to 1997 Test was one of the few weathervane seats which was won by whichever party won the general election as a whole, and as a consequence it changed hands five times in our fairly evenly contested two party system between 1955 and 1979. Then in the most recent boundary changes it was tipped to the left by the removal of the Tories' safest ward, Bassett, to join the Romsey seat. This probably added about 3,000 votes to Labour's relative position. Combined with the much larger effect of the national double figure swing to Labour, this added up to a majority of over 13,500 for Alan Whitehead, a perennial candidate here in west Southampton, which does not seem marginal at all any longer. The demographics tell the story: although very much in southern England, households here are decidedly less wealthy than the British average. Although including most of the attractive central Common in this green city of parks, and the educational centre of Shirley ward, Test is a not an affluent seat and will now prove a stern trial to any Tory attempting recovery.

Dr Alan Whitehead, former leader of Southampton City Council and ex "Professor of Public Policy at Southampton Institute", was third time lucky here in 1997, when on the one last avalanche principle, he replaced a 585 Tory majority with his own 13,684 majority. An airbrushed ex-leftwinger who attacked as "electoralism" Denis Healey's call at the 1983 Party Conference for Labour to become a mainstream party again, he now, with beard reduced to bushy moustache, mundanely extols the merits of regional government, and intones the mantra of an "integrated transport policy" (having wanted to build a light railway in Southampton), and has joined fellow intellectual Baroness Blackstone as her PPS. Born 1950 and educated at Isleworth Grammar School and Southampton University, acquiring a PhD in politics, he ran the British Institute of Industrial Therapy. He plausibly mocks the Liberal Democrats as 'a franchise party', with whoever controls the local photocopier leading the local policy.
 |
| Wealthy Achievers, Suburban Areas |
6.83% |
14.99% |
45.55 |
|
| Affluent Greys, Rural Communities |
0.16% |
2.13% |
7.35 |
|
| Prosperous Pensioners, Retirement Areas |
2.33% |
2.49% |
93.60 |
|
| Affluent Executives, Family Areas |
0.41% |
4.43% |
9.30 |
|
| Well-Off Workers, Family Areas |
1.90% |
7.27% |
26.06 |
|
| Affluent Urbanites, Town & City Areas |
9.56% |
2.56% |
372.94 |
|
| Prosperous Professionals, Metropolitan Areas |
1.14% |
2.04% |
56.07 |
|
| Better-Off Executives, Inner City Areas |
10.80% |
3.94% |
273.81 |
|
| Comfortable Middle Agers, Mature Home Owning Areas |
12.60% |
13.04% |
96.65 |
|
| Skilled Workers, Home Owning Areas |
10.55% |
12.70% |
83.05 |
|
| New Home Owners, Mature Communities |
4.17% |
8.14% |
51.18 |
|
| White Collar Workers, Better-Off Multi Ethnic Areas |
9.03% |
4.02% |
224.58 |
|
| Older People, Less Prosperous Areas |
6.59% |
3.19% |
206.94 |
|
| Council Estate Residents, Better-Off Homes |
18.75% |
11.31% |
165.77 |
|
| Council Estate Residents, High Unemployment |
2.67% |
3.06% |
87.12 |
|
| Council Estate Residents, Greatest Hardship |
1.74% |
2.52% |
69.03 |
|
| People in Multi-Ethnic, Low-Income Areas |
0.76% |
2.10% |
36.30 |
|
| Unclassified |
0.01% |
0.06% |
17.33 |
|
|
 |
 |
 |
| £0-5K |
11.39% |
9.41% |
121.01 |
|
| £5-10K |
19.16% |
16.63% |
115.20 |
|
| £10-15K |
18.29% |
16.58% |
110.31 |
|
| £15-20K |
14.21% |
13.58% |
104.64 |
|
| £20-25K |
10.26% |
10.39% |
98.72 |
|
| £25-30K |
7.23% |
7.77% |
92.98 |
|
| £30-35K |
5.08% |
5.79% |
87.65 |
|
| £35-40K |
3.59% |
4.33% |
82.81 |
|
| £40-45K |
2.56% |
3.27% |
78.49 |
|
| £45-50K |
1.85% |
2.48% |
74.65 |
|
| £50-55K |
1.36% |
1.90% |
71.25 |
|
| £55-60K |
1.01% |
1.47% |
68.24 |
|
| £60-65K |
0.75% |
1.15% |
65.57 |
|
| £65-70K |
0.57% |
0.91% |
63.19 |
|
| £70-75K |
0.44% |
0.72% |
61.07 |
|
| £75-80K |
0.34% |
0.57% |
59.18 |
|
| £80-85K |
0.27% |
0.46% |
57.49 |
|
| £85-90K |
0.21% |
0.37% |
55.96 |
|
| £90-95K |
0.17% |
0.31% |
54.59 |
|
| £95-100K |
0.13% |
0.25% |
53.35 |
|
| £100K + |
0.65% |
1.34% |
48.16 |
|
|
|

|


|
1992-1997
|
1997-2001
|
|
|
|
| Con |
-12.35% |
| Lab |
8.65% |
| LD |
0.57% |
|
| Con |
-2.52% |
| Lab |
-1.66% |
| LD |
4.42% |
|
|
 |
Alan Whitehead
Labour hold
|
| Con |
 |
10,617 |
25.54% |
| Lab |
 |
21,824 |
52.49% |
| LD |
 |
7,522 |
18.09% |
| Oth |
 |
1,612 |
3.88% |
| Maj |
 |
11,207 |
26.96% |
| Turn |
 |
41,575 |
56.26% |
|
|
 |
Alan Whitehead
Labour hold
|
| SA |
Mark Abel |
442 |
1.06% |
| SL |
Paramjit Bahia |
378 |
0.91% |
| C |
Richard Gueterbock |
10,617 |
25.54% |
| UK |
Garry Rankin-Moore |
792 |
1.90% |
| LD |
John Shaw |
7,522 |
18.09% |
| L |
Alan Whitehead |
21,824 |
52.49% |
|
Candidates representing 6 parties stood for election to this seat.
|
|
 |
Alan Whitehead
Labour
|
| Con |
 |
14,712 |
28.05% |
| Lab |
 |
28,396 |
54.15% |
| LD |
 |
7,171 |
13.67% |
| Ref |
 |
1,397 |
2.66% |
| Oth |
 |
765 |
1.46% |
| Maj |
 |
13,684 |
26.09% |
| Turn |
 |
52,441 |
71.85% |
|
|
 |
|
Labour
|
| Con |
 |
21,843 |
40.40% |
| Lab |
 |
24,565 |
45.50% |
| LD |
 |
7,087 |
13.10% |
| Oth |
 |
537 |
1.00% |
| Maj |
 |
2,722 |
5.00% |
| Turn |
 |
54,032 |
75.09% |
|
|
 |
|

|

