|
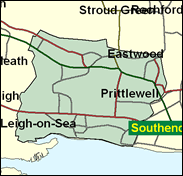
Southend West
Conservative hold

Although the Liberal Democrats and their differently named predecessors have a long history of success, albeit at local council level only, in Southend West, the Tories won five of the seven seats at stake here in May 2000 on the Southend Unitary Authority, and finished 30pc ahead (of Labour) in the 1999 Euro voting within the seat. This is now safe for David Amess, whose rather successful parliamentary career is set to continue for the foreseeable future. If one is looking for the other half of Southend, it is to be found under "Rochford and Southend East".

David Amess, the original Basildon man whose retention of the seat in 1992 heralded the Conservatives' unexpected re-election, chicken-ran to this safer seat, in justifiable expectation of Labour seizing Basildon in 1997. Born into the East End Catholic working class in 1952, he attended St Bonaventure's Grammar School, Newham, and Bournemouth College of Technology, and worked largely in agencies specialising in book keeping and temping. A clearly articulated if almost self-parodying partisan rightwinger, he was Portillo's PPS for ten years, votes the Catholic line on embryo research and abortion, is in the small Tory minority opposed to fox hunting, and brings to Southend his compatible whelk stall Cockney brogue in place of the upper class Etonian drawl of his Guinness dynasty predecessor, Paul Channon. Richard de Ste Croix, a Channel Islander, is the would-be harvester of the tactical votes for the Liberal Democrats here. A solicitor, born in 1947, and with an educational pedigree of Victoria College, Jersey, and Pembroke College, Oxford, his election would restore to Southend West some of the patrician credentials lost with Channon's retirement in 1997.
 |
| Wealthy Achievers, Suburban Areas |
15.17% |
14.99% |
101.20 |
|
| Affluent Greys, Rural Communities |
0.00% |
2.13% |
0.00 |
|
| Prosperous Pensioners, Retirement Areas |
6.92% |
2.49% |
278.27 |
|
| Affluent Executives, Family Areas |
2.01% |
4.43% |
45.48 |
|
| Well-Off Workers, Family Areas |
3.26% |
7.27% |
44.80 |
|
| Affluent Urbanites, Town & City Areas |
1.20% |
2.56% |
46.67 |
|
| Prosperous Professionals, Metropolitan Areas |
4.88% |
2.04% |
239.23 |
|
| Better-Off Executives, Inner City Areas |
4.37% |
3.94% |
110.87 |
|
| Comfortable Middle Agers, Mature Home Owning Areas |
32.58% |
13.04% |
249.84 |
|
| Skilled Workers, Home Owning Areas |
8.70% |
12.70% |
68.46 |
|
| New Home Owners, Mature Communities |
9.86% |
8.14% |
121.07 |
|
| White Collar Workers, Better-Off Multi Ethnic Areas |
6.91% |
4.02% |
171.84 |
|
| Older People, Less Prosperous Areas |
1.65% |
3.19% |
51.78 |
|
| Council Estate Residents, Better-Off Homes |
2.14% |
11.31% |
18.89 |
|
| Council Estate Residents, High Unemployment |
0.36% |
3.06% |
11.60 |
|
| Council Estate Residents, Greatest Hardship |
0.00% |
2.52% |
0.00 |
|
| People in Multi-Ethnic, Low-Income Areas |
0.00% |
2.10% |
0.00 |
|
| Unclassified |
0.00% |
0.06% |
0.00 |
|
|
 |
 |
 |
| £0-5K |
8.01% |
9.41% |
85.06 |
|
| £5-10K |
14.46% |
16.63% |
86.94 |
|
| £10-15K |
15.39% |
16.58% |
92.81 |
|
| £15-20K |
13.38% |
13.58% |
98.49 |
|
| £20-25K |
10.73% |
10.39% |
103.28 |
|
| £25-30K |
8.33% |
7.77% |
107.18 |
|
| £30-35K |
6.39% |
5.79% |
110.36 |
|
| £35-40K |
4.89% |
4.33% |
112.95 |
|
| £40-45K |
3.76% |
3.27% |
115.12 |
|
| £45-50K |
2.90% |
2.48% |
116.96 |
|
| £50-55K |
2.26% |
1.90% |
118.56 |
|
| £55-60K |
1.77% |
1.47% |
119.98 |
|
| £60-65K |
1.40% |
1.15% |
121.26 |
|
| £65-70K |
1.11% |
0.91% |
122.45 |
|
| £70-75K |
0.89% |
0.72% |
123.57 |
|
| £75-80K |
0.72% |
0.57% |
124.63 |
|
| £80-85K |
0.58% |
0.46% |
125.65 |
|
| £85-90K |
0.47% |
0.37% |
126.64 |
|
| £90-95K |
0.39% |
0.31% |
127.61 |
|
| £95-100K |
0.32% |
0.25% |
128.56 |
|
| £100K + |
1.82% |
1.34% |
135.23 |
|
|
|

|


|
1992-1997
|
1997-2001
|
|
|
|
| Con |
-15.94% |
| Lab |
10.49% |
| LD |
2.24% |
|
| Con |
7.56% |
| Lab |
2.29% |
| LD |
-8.20% |
|
|
 |
David Amess
Conservative hold
|
| Con |
 |
17,313 |
46.32% |
| Lab |
 |
9,372 |
25.08% |
| LD |
 |
9,319 |
24.93% |
| Oth |
 |
1,371 |
3.67% |
| Maj |
 |
7,941 |
21.25% |
| Turn |
 |
37,375 |
58.29% |
|
|
 |
David Amess
Conservative hold
|
| C |
David Amess |
17,313 |
46.32% |
| LD |
Richard de Ste Croix |
9,319 |
24.93% |
| L |
Paul Fisher |
9,372 |
25.08% |
| UK |
Brian Lee |
1,371 |
3.67% |
|
Candidates representing 4 parties stood for election to this seat.
|
|
 |
David Amess
Conservative
|
| Con |
 |
18,029 |
38.76% |
| Lab |
 |
10,600 |
22.79% |
| LD |
 |
15,414 |
33.14% |
| Ref |
 |
1,734 |
3.73% |
| Oth |
 |
737 |
1.58% |
| Maj |
 |
2,615 |
5.62% |
| Turn |
 |
46,514 |
69.95% |
|
|
 |
|
Conservative
|
| Con |
 |
27,319 |
54.70% |
| Lab |
 |
6,139 |
12.30% |
| LD |
 |
15,417 |
30.90% |
| Oth |
 |
1,073 |
2.10% |
| Maj |
 |
11,902 |
23.80% |
| Turn |
 |
49,948 |
77.06% |
|
|
 |
|

|

