|
Southport
Liberal Democrat hold

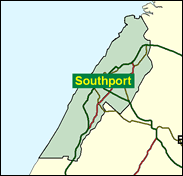
The popular local figure Ronnie Fearn, long time councillor and serial Mayor, is retirng from Southport after his second term (the two separated by a five year gap) at the age of 70. Many might think that this genteel resort situated between Liverpool and Blackpool, but sharing the characteristics of neither, would now revert to the Conservatives. However, most smart local money is that Fearn will successfully pass it on to his party's Sefton Metropolitan Borough council leader John Pugh, who is in the best position to tap into the Lib Dems' effective and established local machine.

In place of their retiring pantomime dame Ronnie Fearn, the Liberal Democrats have selected Dr John Pugh, leader of Sefton Borough Council and Head of Philosophy at the nearby private Merchant Taylors' School, Crosby. A teacher for thirty years, he was born in 1948, and educated at Maidstone Grammar School and Durham University. Somewhat menacingly, the Conservative candidate Laurence Jones is an undertaker from the Wirral, and a member of the George Formby Society.
 |
| Wealthy Achievers, Suburban Areas |
22.78% |
14.99% |
151.95 |
|
| Affluent Greys, Rural Communities |
0.00% |
2.13% |
0.00 |
|
| Prosperous Pensioners, Retirement Areas |
11.05% |
2.49% |
444.62 |
|
| Affluent Executives, Family Areas |
1.11% |
4.43% |
25.11 |
|
| Well-Off Workers, Family Areas |
3.45% |
7.27% |
47.39 |
|
| Affluent Urbanites, Town & City Areas |
2.47% |
2.56% |
96.19 |
|
| Prosperous Professionals, Metropolitan Areas |
0.00% |
2.04% |
0.00 |
|
| Better-Off Executives, Inner City Areas |
9.13% |
3.94% |
231.38 |
|
| Comfortable Middle Agers, Mature Home Owning Areas |
38.96% |
13.04% |
298.81 |
|
| Skilled Workers, Home Owning Areas |
2.14% |
12.70% |
16.85 |
|
| New Home Owners, Mature Communities |
6.46% |
8.14% |
79.28 |
|
| White Collar Workers, Better-Off Multi Ethnic Areas |
0.97% |
4.02% |
24.21 |
|
| Older People, Less Prosperous Areas |
0.19% |
3.19% |
5.84 |
|
| Council Estate Residents, Better-Off Homes |
0.63% |
11.31% |
5.60 |
|
| Council Estate Residents, High Unemployment |
0.00% |
3.06% |
0.00 |
|
| Council Estate Residents, Greatest Hardship |
0.66% |
2.52% |
26.31 |
|
| People in Multi-Ethnic, Low-Income Areas |
0.00% |
2.10% |
0.00 |
|
| Unclassified |
0.00% |
0.06% |
0.00 |
|
|
 |
 |
 |
| £0-5K |
8.58% |
9.41% |
91.13 |
|
| £5-10K |
16.51% |
16.63% |
99.27 |
|
| £10-15K |
17.28% |
16.58% |
104.23 |
|
| £15-20K |
14.37% |
13.58% |
105.83 |
|
| £20-25K |
10.95% |
10.39% |
105.36 |
|
| £25-30K |
8.07% |
7.77% |
103.83 |
|
| £30-35K |
5.90% |
5.79% |
101.84 |
|
| £35-40K |
4.32% |
4.33% |
99.72 |
|
| £40-45K |
3.19% |
3.27% |
97.63 |
|
| £45-50K |
2.37% |
2.48% |
95.67 |
|
| £50-55K |
1.79% |
1.90% |
93.85 |
|
| £55-60K |
1.36% |
1.47% |
92.18 |
|
| £60-65K |
1.04% |
1.15% |
90.67 |
|
| £65-70K |
0.81% |
0.91% |
89.29 |
|
| £70-75K |
0.63% |
0.72% |
88.04 |
|
| £75-80K |
0.50% |
0.57% |
86.90 |
|
| £80-85K |
0.40% |
0.46% |
85.86 |
|
| £85-90K |
0.32% |
0.37% |
84.91 |
|
| £90-95K |
0.26% |
0.31% |
84.03 |
|
| £95-100K |
0.21% |
0.25% |
83.22 |
|
| £100K + |
1.06% |
1.34% |
79.14 |
|
|
|

|


|
1992-1997
|
1997-2001
|
|
|
|
| Con |
-11.06% |
| Lab |
1.91% |
| LD |
6.62% |
|
| Con |
0.52% |
| Lab |
4.46% |
| LD |
-4.35% |
|
|
 |
John Pugh
Liberal Democrat hold
|
| Con |
 |
15,004 |
36.46% |
| Lab |
 |
6,816 |
16.56% |
| LD |
 |
18,011 |
43.77% |
| Oth |
 |
1,322 |
3.21% |
| Maj |
 |
3,007 |
7.31% |
| Turn |
 |
41,153 |
58.14% |
|
|
 |
John Pugh
Liberal Democrat hold
|
| L |
Paul Brant |
6,816 |
16.56% |
| LB |
David Green |
767 |
1.86% |
| C |
Laurence Jones |
15,004 |
36.46% |
| UK |
Gerry Kelley |
555 |
1.35% |
| LD |
John Pugh |
18,011 |
43.77% |
|
Candidates representing 5 parties stood for election to this seat.
|
|
 |
Ronnie Fearn
Liberal Democrat gain
|
| Con |
 |
18,186 |
35.94% |
| Lab |
 |
6,125 |
12.11% |
| LD |
 |
24,346 |
48.12% |
| Ref |
 |
1,368 |
2.70% |
| Oth |
 |
571 |
1.13% |
| Maj |
 |
6,160 |
12.17% |
| Turn |
 |
50,596 |
72.08% |
|
|
 |
|
Conservative
|
| Con |
 |
26,081 |
47.00% |
| Lab |
 |
5,637 |
10.20% |
| LD |
 |
23,018 |
41.50% |
| Oth |
 |
704 |
1.30% |
| Maj |
 |
3,063 |
5.50% |
| Turn |
 |
55,440 |
76.33% |
|
|
 |
|

|

