|
Southwark North & Bermondsey
Liberal Democrat hold

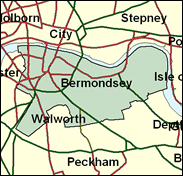
Simon Hughes has now won in this tough part of inner-city South London five times in all, including in the very particular circumstances of the "Peter Tatchell" byelection of 1982 when Labour was nationally and locally divided, and placed in a political position which seems unrecognisable now. It is to his credit that he has survived that transmutation to New Labour, and is now a familiar and popular figure, with enough local backing to expect a sixth term. It should also be noted that it is not just a matter of success at general elections. The Liberal Democrats dominate the local scene on Southwark Council too, obtaining nearly 56pc of the vote here in the most recent (1998) ward elections.

Simon Hughes, Liberal victor over another bachelor, Labour's openly homosexual Peter Tatchell, in the 1983 byelection, has skilfully retained this inner city working class seat for almost twenty years against Labour, without recourse to the crude populism of Cyril Smith in Rochdale. A barrister, born 1951 and educated at Christ's College, Brecon, Selwyn College Cambridge and the Inns of Court School of Law, clean cut and well-scrubbed, he is variously likened to a self-righteous prep school master, or to a vicar who'd let you beat him at table tennis. Himself beaten by Charles Kennedy for the Liberal Democrat leadership in 1999, he now leads on Home Affairs for his party.
 |
| Wealthy Achievers, Suburban Areas |
0.00% |
14.99% |
0.00 |
|
| Affluent Greys, Rural Communities |
0.00% |
2.13% |
0.00 |
|
| Prosperous Pensioners, Retirement Areas |
0.00% |
2.49% |
0.00 |
|
| Affluent Executives, Family Areas |
0.14% |
4.43% |
3.14 |
|
| Well-Off Workers, Family Areas |
0.00% |
7.27% |
0.00 |
|
| Affluent Urbanites, Town & City Areas |
7.31% |
2.56% |
285.11 |
|
| Prosperous Professionals, Metropolitan Areas |
1.20% |
2.04% |
58.74 |
|
| Better-Off Executives, Inner City Areas |
7.31% |
3.94% |
185.36 |
|
| Comfortable Middle Agers, Mature Home Owning Areas |
0.12% |
13.04% |
0.91 |
|
| Skilled Workers, Home Owning Areas |
1.68% |
12.70% |
13.26 |
|
| New Home Owners, Mature Communities |
0.00% |
8.14% |
0.01 |
|
| White Collar Workers, Better-Off Multi Ethnic Areas |
7.58% |
4.02% |
188.38 |
|
| Older People, Less Prosperous Areas |
0.00% |
3.19% |
0.00 |
|
| Council Estate Residents, Better-Off Homes |
1.90% |
11.31% |
16.77 |
|
| Council Estate Residents, High Unemployment |
44.13% |
3.06% |
1,441.25 |
|
| Council Estate Residents, Greatest Hardship |
0.00% |
2.52% |
0.00 |
|
| People in Multi-Ethnic, Low-Income Areas |
28.63% |
2.10% |
1,363.32 |
|
| Unclassified |
0.00% |
0.06% |
0.00 |
|
|
 |
 |
 |
| £0-5K |
9.13% |
9.41% |
97.02 |
|
| £5-10K |
14.83% |
16.63% |
89.17 |
|
| £10-15K |
15.02% |
16.58% |
90.59 |
|
| £15-20K |
12.75% |
13.58% |
93.89 |
|
| £20-25K |
10.13% |
10.39% |
97.49 |
|
| £25-30K |
7.84% |
7.77% |
100.89 |
|
| £30-35K |
6.02% |
5.79% |
103.94 |
|
| £35-40K |
4.62% |
4.33% |
106.59 |
|
| £40-45K |
3.55% |
3.27% |
108.87 |
|
| £45-50K |
2.75% |
2.48% |
110.80 |
|
| £50-55K |
2.14% |
1.90% |
112.42 |
|
| £55-60K |
1.68% |
1.47% |
113.77 |
|
| £60-65K |
1.32% |
1.15% |
114.87 |
|
| £65-70K |
1.05% |
0.91% |
115.75 |
|
| £70-75K |
0.84% |
0.72% |
116.45 |
|
| £75-80K |
0.67% |
0.57% |
116.98 |
|
| £80-85K |
0.54% |
0.46% |
117.36 |
|
| £85-90K |
0.44% |
0.37% |
117.62 |
|
| £90-95K |
0.36% |
0.31% |
117.76 |
|
| £95-100K |
0.29% |
0.25% |
117.81 |
|
| £100K + |
1.55% |
1.34% |
115.46 |
|
|
|

|


|
1992-1997
|
1997-2001
|
|
|
|
| Con |
-5.05% |
| Lab |
5.81% |
| LD |
-2.79% |
|
| Con |
0.65% |
| Lab |
-9.49% |
| LD |
8.33% |
|
|
 |
Simon Hughes
Liberal Democrat hold
|
| Con |
 |
2,800 |
7.60% |
| Lab |
 |
11,359 |
30.81% |
| LD |
 |
20,991 |
56.94% |
| Oth |
 |
1,712 |
4.64% |
| Maj |
 |
9,632 |
26.13% |
| Turn |
 |
36,862 |
50.13% |
|
|
 |
Simon Hughes
Liberal Democrat hold
|
| L |
Kingsley Abrams |
11,359 |
30.81% |
| I |
John Davies |
77 |
0.21% |
| LD |
Simon Hughes |
20,991 |
56.94% |
| G |
Ruth Jenkins |
752 |
2.04% |
| UK |
Rob McWhirter |
271 |
0.74% |
| NF |
Lianne Shore |
612 |
1.66% |
| C |
Ewan Wallace |
2,800 |
7.60% |
|
Candidates representing 7 parties stood for election to this seat.
|
|
 |
Simon Hughes
Liberal Democrat
|
| Con |
 |
2,835 |
6.95% |
| Lab |
 |
16,444 |
40.31% |
| LD |
 |
19,831 |
48.61% |
| Ref |
 |
545 |
1.34% |
| Oth |
 |
1,140 |
2.79% |
| Maj |
 |
3,387 |
8.30% |
| Turn |
 |
40,795 |
62.19% |
|
|
 |
|
Liberal Democrat
|
| Con |
 |
5,170 |
12.00% |
| Lab |
 |
14,889 |
34.50% |
| LD |
 |
22,158 |
51.40% |
| Oth |
 |
909 |
2.10% |
| Maj |
 |
7,269 |
16.90% |
| Turn |
 |
43,126 |
62.49% |
|
|
 |
|

|

