|
Spelthorne
Conservative hold

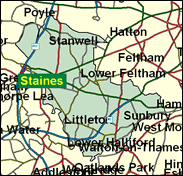
Spelthorne is that part of Middlesex which resolutely refused to go into Greater London when the GLC was created in 1965, and still vigorously resists any attempt to associate itself with that great wen and pit of sedition, even in a European Parliament constituency. This may seem strange, as it is north of the Thames, which sits oddly with the rest of Surrey. But Spelthorne (Ashford and Staines, Sunbury and Shepperton) prefers to be on the Surrey side politically. It has always been Conservative, and although not particularly upper class, it is very heavily owner occupied, and 97pc white, which is a very different picture from that found just on the other side of Heathrow Airport in Hounslow. It is this demographic and geographic situation that colours Spelthorne's resistance, to London and to Labour. Ali G must have been joking about the Staines Massive; is that man for real?

David Wilshire, a man with a somewhat variegated repertoire, elected in 1987, is a hardline rightwinger who backed the successful Paisleyite candidate in the September 2000 Antrim South byelection, was a last ditch defender of the poll tax, and backed Redwood in all three leadership ballots in 1997. He takes the liberal lines on embryo research and capital punishment but not on hippy new age travellers, whom he would like to send to a mid-Atlantic island on a one-way ticket. Born in 1943, he attended the Methodist public school, Kingswood, and Fitzwilliam College Cambridge, ran a sports and camping business, and was a waste-cutting leader of Wansdyke District Council for six years.
 |
| Wealthy Achievers, Suburban Areas |
20.29% |
14.99% |
135.36 |
|
| Affluent Greys, Rural Communities |
0.00% |
2.13% |
0.00 |
|
| Prosperous Pensioners, Retirement Areas |
1.94% |
2.49% |
78.23 |
|
| Affluent Executives, Family Areas |
2.59% |
4.43% |
58.54 |
|
| Well-Off Workers, Family Areas |
19.24% |
7.27% |
264.53 |
|
| Affluent Urbanites, Town & City Areas |
3.97% |
2.56% |
154.77 |
|
| Prosperous Professionals, Metropolitan Areas |
1.30% |
2.04% |
63.87 |
|
| Better-Off Executives, Inner City Areas |
0.59% |
3.94% |
14.84 |
|
| Comfortable Middle Agers, Mature Home Owning Areas |
29.63% |
13.04% |
227.25 |
|
| Skilled Workers, Home Owning Areas |
9.36% |
12.70% |
73.72 |
|
| New Home Owners, Mature Communities |
5.77% |
8.14% |
70.87 |
|
| White Collar Workers, Better-Off Multi Ethnic Areas |
0.00% |
4.02% |
0.00 |
|
| Older People, Less Prosperous Areas |
1.71% |
3.19% |
53.62 |
|
| Council Estate Residents, Better-Off Homes |
2.85% |
11.31% |
25.21 |
|
| Council Estate Residents, High Unemployment |
0.74% |
3.06% |
24.26 |
|
| Council Estate Residents, Greatest Hardship |
0.00% |
2.52% |
0.00 |
|
| People in Multi-Ethnic, Low-Income Areas |
0.00% |
2.10% |
0.00 |
|
| Unclassified |
0.00% |
0.06% |
0.00 |
|
|
 |
 |
 |
| £0-5K |
4.66% |
9.41% |
49.55 |
|
| £5-10K |
10.23% |
16.63% |
61.52 |
|
| £10-15K |
12.66% |
16.58% |
76.39 |
|
| £15-20K |
12.44% |
13.58% |
91.55 |
|
| £20-25K |
11.01% |
10.39% |
105.89 |
|
| £25-30K |
9.25% |
7.77% |
118.96 |
|
| £30-35K |
7.57% |
5.79% |
130.62 |
|
| £35-40K |
6.11% |
4.33% |
140.92 |
|
| £40-45K |
4.90% |
3.27% |
149.94 |
|
| £45-50K |
3.92% |
2.48% |
157.82 |
|
| £50-55K |
3.14% |
1.90% |
164.70 |
|
| £55-60K |
2.52% |
1.47% |
170.69 |
|
| £60-65K |
2.03% |
1.15% |
175.91 |
|
| £65-70K |
1.64% |
0.91% |
180.48 |
|
| £70-75K |
1.33% |
0.72% |
184.47 |
|
| £75-80K |
1.08% |
0.57% |
187.97 |
|
| £80-85K |
0.88% |
0.46% |
191.03 |
|
| £85-90K |
0.73% |
0.37% |
193.73 |
|
| £90-95K |
0.60% |
0.31% |
196.10 |
|
| £95-100K |
0.50% |
0.25% |
198.18 |
|
| £100K + |
2.76% |
1.34% |
205.58 |
|
|
|

|


|
1992-1997
|
1997-2001
|
|
|
|
| Con |
-13.61% |
| Lab |
15.30% |
| LD |
-3.36% |
|
| Con |
0.21% |
| Lab |
-0.90% |
| LD |
1.59% |
|
|
 |
David Wilshire
Conservative hold
|
| Con |
 |
18,851 |
45.10% |
| Lab |
 |
15,589 |
37.30% |
| LD |
 |
6,156 |
14.73% |
| Oth |
 |
1,198 |
2.87% |
| Maj |
 |
3,262 |
7.80% |
| Turn |
 |
41,794 |
60.81% |
|
|
 |
David Wilshire
Conservative hold
|
| LD |
Martin Rimmer |
6,156 |
14.73% |
| L |
Andrew Shaw |
15,589 |
37.30% |
| UK |
Richard Squire |
1,198 |
2.87% |
| C |
David Wilshire |
18,851 |
45.10% |
|
Candidates representing 4 parties stood for election to this seat.
|
|
 |
David Wilshire
Conservative
|
| Con |
 |
23,306 |
44.89% |
| Lab |
 |
19,833 |
38.20% |
| LD |
 |
6,821 |
13.14% |
| Ref |
 |
1,495 |
2.88% |
| Oth |
 |
462 |
0.89% |
| Maj |
 |
3,473 |
6.69% |
| Turn |
 |
51,917 |
73.58% |
|
|
 |
|
Conservative
|
| Con |
 |
32,627 |
58.50% |
| Lab |
 |
12,784 |
22.90% |
| LD |
 |
9,202 |
16.50% |
| Oth |
 |
1,113 |
2.00% |
| Maj |
 |
19,843 |
35.60% |
| Turn |
 |
55,726 |
86.74% |
|
|
 |
|

|

