|
Stafford
Labour hold

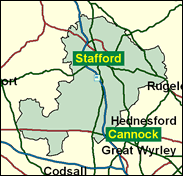
The Conservatives must manage the swing of over four per cent needed to take Stafford if they are to come even close to dislodging Mr Blair and Mr Brown from Downing Street. David Cameron, charged with its defence in 1997, has gone off to better ground at Witney (where Sean Woodward has defected to the Labour Party), but Philip Cochrane takes up the baton. Electoral evidence here since 1997 points towards a photo-finish between Cochrane and the current MP, David Kidney. Stafford is a medium to large self-contained town with a variety of neighbourhoods, although its local authority housing tenure and non-white resident figures are lower than average, which tips it to the Conservatives should there be an even year.

David Kidney, Labour victor here in 1997, is a local solicitor and former councillor, born 1955 and educated at Longton High School, City of Stoke Sixth Form College and Bristol University. A loyalist to the extent of endorsing the party's volte face between Opposition and Office on air traffic control privatisation, he campaigns on local issues, such as the post-water-privatisation running of small sewage works and the state of the services on the West Coast main line bisecting his constituency. His Tory nemesis looms in the shape of Philip Cochrane, an Ulsterman, born in 1970 and educated at Coleraine Academical Institution and at Aberdeen and Reading Universities, who is a head office manager at Equitable Life. A Buckinghamshire County councillor, and former researcher for ex-MP Dame Angela Rumbold, he has called, as a farmer's son, for better arbitration of tenant farmers' rent reviews, for sensible labelling of alco-pops and for earlier notification of council rate cap limits.
 |
| Wealthy Achievers, Suburban Areas |
24.83% |
14.99% |
165.59 |
|
| Affluent Greys, Rural Communities |
0.26% |
2.13% |
12.32 |
|
| Prosperous Pensioners, Retirement Areas |
0.73% |
2.49% |
29.26 |
|
| Affluent Executives, Family Areas |
13.55% |
4.43% |
306.19 |
|
| Well-Off Workers, Family Areas |
11.78% |
7.27% |
162.01 |
|
| Affluent Urbanites, Town & City Areas |
0.84% |
2.56% |
32.85 |
|
| Prosperous Professionals, Metropolitan Areas |
0.00% |
2.04% |
0.00 |
|
| Better-Off Executives, Inner City Areas |
1.35% |
3.94% |
34.20 |
|
| Comfortable Middle Agers, Mature Home Owning Areas |
9.48% |
13.04% |
72.67 |
|
| Skilled Workers, Home Owning Areas |
9.95% |
12.70% |
78.35 |
|
| New Home Owners, Mature Communities |
10.78% |
8.14% |
132.35 |
|
| White Collar Workers, Better-Off Multi Ethnic Areas |
4.82% |
4.02% |
119.92 |
|
| Older People, Less Prosperous Areas |
3.93% |
3.19% |
123.39 |
|
| Council Estate Residents, Better-Off Homes |
4.28% |
11.31% |
37.87 |
|
| Council Estate Residents, High Unemployment |
0.61% |
3.06% |
20.04 |
|
| Council Estate Residents, Greatest Hardship |
2.44% |
2.52% |
96.71 |
|
| People in Multi-Ethnic, Low-Income Areas |
0.00% |
2.10% |
0.00 |
|
| Unclassified |
0.37% |
0.06% |
588.81 |
|
|
 |
 |
 |
| £0-5K |
7.61% |
9.41% |
80.86 |
|
| £5-10K |
15.27% |
16.63% |
91.81 |
|
| £10-15K |
16.31% |
16.58% |
98.39 |
|
| £15-20K |
13.94% |
13.58% |
102.61 |
|
| £20-25K |
10.95% |
10.39% |
105.39 |
|
| £25-30K |
8.34% |
7.77% |
107.24 |
|
| £30-35K |
6.28% |
5.79% |
108.43 |
|
| £35-40K |
4.73% |
4.33% |
109.11 |
|
| £40-45K |
3.57% |
3.27% |
109.40 |
|
| £45-50K |
2.72% |
2.48% |
109.39 |
|
| £50-55K |
2.08% |
1.90% |
109.13 |
|
| £55-60K |
1.60% |
1.47% |
108.68 |
|
| £60-65K |
1.24% |
1.15% |
108.09 |
|
| £65-70K |
0.97% |
0.91% |
107.38 |
|
| £70-75K |
0.77% |
0.72% |
106.59 |
|
| £75-80K |
0.61% |
0.57% |
105.74 |
|
| £80-85K |
0.48% |
0.46% |
104.85 |
|
| £85-90K |
0.39% |
0.37% |
103.92 |
|
| £90-95K |
0.31% |
0.31% |
102.98 |
|
| £95-100K |
0.26% |
0.25% |
102.02 |
|
| £100K + |
1.28% |
1.34% |
95.56 |
|
|
|

|


|
1992-1997
|
1997-2001
|
|
|
|
| Con |
-8.91% |
| Lab |
12.63% |
| LD |
-5.92% |
|
| Con |
-2.56% |
| Lab |
0.45% |
| LD |
-1.11% |
|
|
 |
David Kidney
Labour hold
|
| Con |
 |
16,253 |
36.63% |
| Lab |
 |
21,285 |
47.98% |
| LD |
 |
4,205 |
9.48% |
| Oth |
 |
2,623 |
5.91% |
| Maj |
 |
5,032 |
11.34% |
| Turn |
 |
44,366 |
65.31% |
|
|
 |
David Kidney
Labour hold
|
| UK |
Earl of Bradford |
2,315 |
5.22% |
| C |
Phil Cochrane |
16,253 |
36.63% |
| RRL |
Michael Hames |
308 |
0.69% |
| L |
David Kidney |
21,285 |
47.98% |
| LD |
Jeanne Pinkerton |
4,205 |
9.48% |
|
Candidates representing 5 parties stood for election to this seat.
|
|
 |
David Kidney
Labour gain
|
| Con |
 |
20,292 |
39.19% |
| Lab |
 |
24,606 |
47.53% |
| LD |
 |
5,480 |
10.58% |
| Ref |
 |
1,146 |
2.21% |
| Oth |
 |
248 |
0.48% |
| Maj |
 |
4,314 |
8.33% |
| Turn |
 |
51,772 |
76.64% |
|
|
 |
|
Conservative
|
| Con |
 |
26,464 |
48.10% |
| Lab |
 |
19,229 |
34.90% |
| LD |
 |
9,097 |
16.50% |
| Oth |
 |
257 |
0.50% |
| Maj |
 |
7,235 |
13.10% |
| Turn |
 |
55,047 |
82.93% |
|
|
 |
|

|

