|
Staffordshire Moorlands
Labour hold

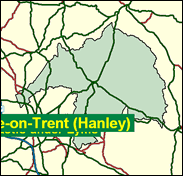
Staffordshire is not usually associated with hills and moors, but some of the most attractive parts of the Peak District, such as the Manifold valley, the Upper Dove near Longnor, and the wild rocks of the Roaches are to be found in this constituency. But this is not the territory which colours the politics of this seat, redrawn much in Labour's favour in 1997, but rather the industrial towns of Biddulph and Kidsgrove just north of Stoke on Trent, which is massively Labour. In fact, the class makeup of Staffordshire Moorlands is well to the manual occupational side of average. The swing recorded last time looks smaller than average, but that it most likely to be due to the difficulties of estimating the hypothetical result for 1992 before the boundary changes. No aberrant behaviour is to be expected next time.

Charlotte Atkins, daughter of former leftwing Preston MP, Ron Atkins, was elected here in 1997. Her own leftwing past is airbrushed, but she was co-author in 1981 with Chris Mullin of the innocuous-sounding 'How to select and reselect your MP', which was actually the leftwing activists' manual for tipping rightwing MPs out of the party and into the SDP. But by 1990 she was the NEC-imposed candidate in the Eastbourne byelection and in the nineties a leading activist in the orthodox pursuit of feminisation via all-women shortlists. In the front row of the famous 'Blair's Babes' photograph, she has been less obtrusive since. Online as well as on-message, she has advocated sacking 'computer-phobic-school teachers.'
 |
| Wealthy Achievers, Suburban Areas |
10.24% |
14.99% |
68.31 |
|
| Affluent Greys, Rural Communities |
4.52% |
2.13% |
212.67 |
|
| Prosperous Pensioners, Retirement Areas |
0.60% |
2.49% |
24.32 |
|
| Affluent Executives, Family Areas |
3.55% |
4.43% |
80.32 |
|
| Well-Off Workers, Family Areas |
17.83% |
7.27% |
245.19 |
|
| Affluent Urbanites, Town & City Areas |
0.03% |
2.56% |
1.34 |
|
| Prosperous Professionals, Metropolitan Areas |
0.00% |
2.04% |
0.00 |
|
| Better-Off Executives, Inner City Areas |
0.02% |
3.94% |
0.45 |
|
| Comfortable Middle Agers, Mature Home Owning Areas |
17.58% |
13.04% |
134.82 |
|
| Skilled Workers, Home Owning Areas |
22.40% |
12.70% |
176.31 |
|
| New Home Owners, Mature Communities |
12.83% |
8.14% |
157.53 |
|
| White Collar Workers, Better-Off Multi Ethnic Areas |
0.55% |
4.02% |
13.80 |
|
| Older People, Less Prosperous Areas |
1.75% |
3.19% |
54.94 |
|
| Council Estate Residents, Better-Off Homes |
7.46% |
11.31% |
65.98 |
|
| Council Estate Residents, High Unemployment |
0.00% |
3.06% |
0.00 |
|
| Council Estate Residents, Greatest Hardship |
0.38% |
2.52% |
15.11 |
|
| People in Multi-Ethnic, Low-Income Areas |
0.00% |
2.10% |
0.00 |
|
| Unclassified |
0.24% |
0.06% |
382.26 |
|
|
 |
 |
 |
| £0-5K |
8.38% |
9.41% |
89.03 |
|
| £5-10K |
17.36% |
16.63% |
104.40 |
|
| £10-15K |
18.26% |
16.58% |
110.11 |
|
| £15-20K |
15.05% |
13.58% |
110.77 |
|
| £20-25K |
11.28% |
10.39% |
108.49 |
|
| £25-30K |
8.13% |
7.77% |
104.63 |
|
| £30-35K |
5.79% |
5.79% |
100.00 |
|
| £35-40K |
4.12% |
4.33% |
95.10 |
|
| £40-45K |
2.95% |
3.27% |
90.21 |
|
| £45-50K |
2.12% |
2.48% |
85.49 |
|
| £50-55K |
1.54% |
1.90% |
81.02 |
|
| £55-60K |
1.13% |
1.47% |
76.84 |
|
| £60-65K |
0.84% |
1.15% |
72.96 |
|
| £65-70K |
0.63% |
0.91% |
69.38 |
|
| £70-75K |
0.48% |
0.72% |
66.07 |
|
| £75-80K |
0.36% |
0.57% |
63.03 |
|
| £80-85K |
0.28% |
0.46% |
60.23 |
|
| £85-90K |
0.22% |
0.37% |
57.66 |
|
| £90-95K |
0.17% |
0.31% |
55.29 |
|
| £95-100K |
0.13% |
0.25% |
53.11 |
|
| £100K + |
0.58% |
1.34% |
43.06 |
|
|
|

|


|
1992-1997
|
1997-2001
|
|
|
|
| Con |
-6.15% |
| Lab |
11.31% |
| LD |
-5.29% |
|
| Con |
2.77% |
| Lab |
-3.20% |
| LD |
1.79% |
|
|
 |
Charlotte Atkins
Labour hold
|
| Con |
 |
15,066 |
35.32% |
| Lab |
 |
20,904 |
49.00% |
| LD |
 |
5,928 |
13.90% |
| Oth |
 |
760 |
1.78% |
| Maj |
 |
5,838 |
13.69% |
| Turn |
 |
42,658 |
63.90% |
|
|
 |
Charlotte Atkins
Labour hold
|
| L |
Charlotte Atkins |
20,904 |
49.00% |
| UK |
Paul Gilbert |
760 |
1.78% |
| C |
Marcus Hayes |
15,066 |
35.32% |
| LD |
John Redfern |
5,928 |
13.90% |
|
Candidates representing 4 parties stood for election to this seat.
|
|
 |
Charlotte Atkins
Labour
|
| Con |
 |
16,637 |
32.55% |
| Lab |
 |
26,686 |
52.21% |
| LD |
 |
6,191 |
12.11% |
| Ref |
 |
1,603 |
3.14% |
| Oth |
|
0 |
0.00% |
| Maj |
 |
10,049 |
19.66% |
| Turn |
 |
51,117 |
77.34% |
|
|
 |
|
Labour
|
| Con |
 |
20,787 |
38.70% |
| Lab |
 |
21,972 |
40.90% |
| LD |
 |
9,381 |
17.40% |
| Oth |
 |
1,629 |
3.00% |
| Maj |
 |
1,185 |
2.20% |
| Turn |
 |
53,769 |
80.20% |
|
|
 |
|

|

