|
Staffordshire South
Conservative hold

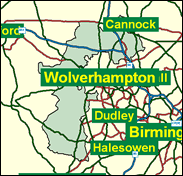
The Conservatives' one safe seat in Staffordshire is this rather suburban seat in the south west of the county, which has no large or widely recognised towns, but rather a series of owner occupied and mainly middle class communities like Wombourne, Perton, Great Wyrley, Codsall and Brewood. This is terrain for residents of neat and tidy newish private estates, between the West Midlands conurbation and the true countryside, 99pc white and exactly 50pc Conservative, which puts in in the top tenth of Conservatism.

Sir Patrick Cormack, first elected in 1970 (when he despatched Nye Bevan's widow, Jennie Lee, to the House of Lords), has the gratifying knowledge that after the election only one other Tory - Sir Peter Tapsell - will have served longer as a Member of (as he daintily pronounces it) 'Parl-y-a-ment.' An orotund and rather splendidly Trollopian figure, who has fashioned a fruity-voiced, disdainful persona out of a Grimsby (born 1939) childhood and a Hull University education, he has been dubbed variously as "a man of such majesty that even colleagues do not always appreciate how majestic he is" (Matthew Parris), and as one "whose frock-coated presence has lent tone to many a St Margaret's memorial service" (Sir Julian Critchley). He has nonetheless a record as a 'One Nation' rebel against Thatcher on the poll tax, dole cuts, GLC abolition, and eye and dental check charges, even if he voted first for Lilley in 1997, and only thereafter for Clarke.
 |
| Wealthy Achievers, Suburban Areas |
26.05% |
14.99% |
173.75 |
|
| Affluent Greys, Rural Communities |
0.67% |
2.13% |
31.54 |
|
| Prosperous Pensioners, Retirement Areas |
0.34% |
2.49% |
13.67 |
|
| Affluent Executives, Family Areas |
12.40% |
4.43% |
280.14 |
|
| Well-Off Workers, Family Areas |
17.92% |
7.27% |
246.34 |
|
| Affluent Urbanites, Town & City Areas |
0.64% |
2.56% |
25.10 |
|
| Prosperous Professionals, Metropolitan Areas |
0.00% |
2.04% |
0.00 |
|
| Better-Off Executives, Inner City Areas |
0.00% |
3.94% |
0.00 |
|
| Comfortable Middle Agers, Mature Home Owning Areas |
18.16% |
13.04% |
139.25 |
|
| Skilled Workers, Home Owning Areas |
8.96% |
12.70% |
70.53 |
|
| New Home Owners, Mature Communities |
8.05% |
8.14% |
98.90 |
|
| White Collar Workers, Better-Off Multi Ethnic Areas |
0.01% |
4.02% |
0.32 |
|
| Older People, Less Prosperous Areas |
1.84% |
3.19% |
57.91 |
|
| Council Estate Residents, Better-Off Homes |
4.56% |
11.31% |
40.28 |
|
| Council Estate Residents, High Unemployment |
0.40% |
3.06% |
13.01 |
|
| Council Estate Residents, Greatest Hardship |
0.00% |
2.52% |
0.00 |
|
| People in Multi-Ethnic, Low-Income Areas |
0.00% |
2.10% |
0.00 |
|
| Unclassified |
0.00% |
0.06% |
0.00 |
|
|
 |
 |
 |
| £0-5K |
7.44% |
9.41% |
79.09 |
|
| £5-10K |
14.02% |
16.63% |
84.32 |
|
| £10-15K |
15.29% |
16.58% |
92.22 |
|
| £15-20K |
13.55% |
13.58% |
99.72 |
|
| £20-25K |
11.02% |
10.39% |
105.98 |
|
| £25-30K |
8.62% |
7.77% |
110.86 |
|
| £30-35K |
6.63% |
5.79% |
114.48 |
|
| £35-40K |
5.07% |
4.33% |
117.02 |
|
| £40-45K |
3.88% |
3.27% |
118.70 |
|
| £45-50K |
2.97% |
2.48% |
119.70 |
|
| £50-55K |
2.29% |
1.90% |
120.17 |
|
| £55-60K |
1.77% |
1.47% |
120.24 |
|
| £60-65K |
1.38% |
1.15% |
120.01 |
|
| £65-70K |
1.08% |
0.91% |
119.55 |
|
| £70-75K |
0.86% |
0.72% |
118.92 |
|
| £75-80K |
0.68% |
0.57% |
118.18 |
|
| £80-85K |
0.54% |
0.46% |
117.36 |
|
| £85-90K |
0.44% |
0.37% |
116.48 |
|
| £90-95K |
0.35% |
0.31% |
115.57 |
|
| £95-100K |
0.29% |
0.25% |
114.64 |
|
| £100K + |
1.46% |
1.34% |
108.86 |
|
|
|

|


|
1992-1997
|
1997-2001
|
|
|
|
| Con |
-9.18% |
| Lab |
8.92% |
| LD |
-3.76% |
|
| Con |
0.46% |
| Lab |
-0.55% |
| LD |
0.25% |
|
|
 |
Patrick Cormack
Conservative hold
|
| Con |
 |
21,295 |
50.49% |
| Lab |
 |
14,414 |
34.17% |
| LD |
 |
4,891 |
11.60% |
| Oth |
 |
1,580 |
3.75% |
| Maj |
 |
6,881 |
16.31% |
| Turn |
 |
42,180 |
60.32% |
|
|
 |
Patrick Cormack
Conservative hold
|
| C |
Patrick Cormack |
21,295 |
50.49% |
| LD |
Jo Harrison |
4,891 |
11.60% |
| L |
Paul Kalinauckas |
14,414 |
34.17% |
| UK |
Mike Lynch |
1,580 |
3.75% |
|
Candidates representing 4 parties stood for election to this seat.
|
|
 |
Patrick Cormack
Conservative
|
| Con |
 |
25,568 |
50.02% |
| Lab |
 |
17,747 |
34.72% |
| LD |
 |
5,797 |
11.34% |
| Ref |
 |
2,002 |
3.92% |
| Oth |
|
0 |
0.00% |
| Maj |
 |
7,821 |
15.30% |
| Turn |
 |
51,114 |
74.19% |
|
|
 |
|
Conservative
|
| Con |
 |
32,982 |
59.20% |
| Lab |
 |
14,367 |
25.80% |
| LD |
 |
8,391 |
15.10% |
| Oth |
|
0 |
0.00% |
| Maj |
 |
18,615 |
33.40% |
| Turn |
 |
55,740 |
81.12% |
|
|
 |
|

|

