|
Stalybridge & Hyde
Labour hold

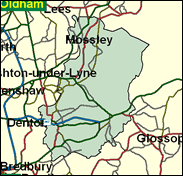
The Cheshire bank of the river Tame within the Greater Manchester Metropolitan Borough of Tameside, across the river (which is not wide) from Lancashire's Ashton under Lyne; this constituency is now solidly Labour, despite the presence of Tory enclaves on the hill as it climbs up on the south side of Stalybridge and in the Werneth ward of Hyde. It mainly consists of old working class former-textile communities, plus the bleak and windy overspill estate of Hattersley, split between Longdendale and Hyde Godley wards, where a clutch of derelict post-war tower blocks were demolished to general cheering in April 2001. Both long-serving Tameside Labour MPs are retiring at the forthcoming general election. Whereas in neighbouring Ashton the replacement is a mature Old Labour stalwart, here is to be found a fast rising star of the modernised party, James Purnell, who is likely to be the only new MP who went to arguably the most elite college in one of the world's elite universities, Balliol College Oxford. With the retirement of Edward Heath (the Father of the House), Peter Brooke, Robert Maclennan, and David Faber, and the possible defeat of the conqueror of Portillo, Stephen Twigg, this seriously reduces Balliol's heavyweight representation in the Commons. What will happen to the country, and indeed the world?

Labour's new candidate in place of the late-retiring Tom Pendry is arguably the most favoured insider to have been parachuted into a safe seat towards the end of the selection process. James Purnell comes from the Downing Street Policy Unit, having worked earlier for Tony Blair in opposition. Born 1970, and a graduate of Balliol College, Oxford, he also has experience working for the IFFR and the BBC, where he was Head of Corporate Planning. A former Islington councillor, he was involved in the spat between the NEC and the barred Leeds candidate Liz Davies, to whom he had to apologise for wrongly accusing her of inciting a crowd at a public meeting.
 |
| Wealthy Achievers, Suburban Areas |
6.66% |
14.99% |
44.43 |
|
| Affluent Greys, Rural Communities |
0.00% |
2.13% |
0.00 |
|
| Prosperous Pensioners, Retirement Areas |
0.00% |
2.49% |
0.00 |
|
| Affluent Executives, Family Areas |
3.21% |
4.43% |
72.55 |
|
| Well-Off Workers, Family Areas |
13.12% |
7.27% |
180.44 |
|
| Affluent Urbanites, Town & City Areas |
0.00% |
2.56% |
0.00 |
|
| Prosperous Professionals, Metropolitan Areas |
0.00% |
2.04% |
0.00 |
|
| Better-Off Executives, Inner City Areas |
0.10% |
3.94% |
2.49 |
|
| Comfortable Middle Agers, Mature Home Owning Areas |
5.24% |
13.04% |
40.21 |
|
| Skilled Workers, Home Owning Areas |
31.58% |
12.70% |
248.61 |
|
| New Home Owners, Mature Communities |
6.35% |
8.14% |
77.92 |
|
| White Collar Workers, Better-Off Multi Ethnic Areas |
0.04% |
4.02% |
1.04 |
|
| Older People, Less Prosperous Areas |
5.34% |
3.19% |
167.49 |
|
| Council Estate Residents, Better-Off Homes |
17.11% |
11.31% |
151.31 |
|
| Council Estate Residents, High Unemployment |
3.31% |
3.06% |
108.23 |
|
| Council Estate Residents, Greatest Hardship |
7.12% |
2.52% |
282.78 |
|
| People in Multi-Ethnic, Low-Income Areas |
0.81% |
2.10% |
38.54 |
|
| Unclassified |
0.00% |
0.06% |
0.00 |
|
|
 |
 |
 |
| £0-5K |
10.32% |
9.41% |
109.60 |
|
| £5-10K |
17.93% |
16.63% |
107.80 |
|
| £10-15K |
17.64% |
16.58% |
106.37 |
|
| £15-20K |
14.16% |
13.58% |
104.27 |
|
| £20-25K |
10.56% |
10.39% |
101.58 |
|
| £25-30K |
7.66% |
7.77% |
98.54 |
|
| £30-35K |
5.52% |
5.79% |
95.34 |
|
| £35-40K |
3.99% |
4.33% |
92.12 |
|
| £40-45K |
2.90% |
3.27% |
88.97 |
|
| £45-50K |
2.13% |
2.48% |
85.92 |
|
| £50-55K |
1.58% |
1.90% |
83.01 |
|
| £55-60K |
1.18% |
1.47% |
80.24 |
|
| £60-65K |
0.89% |
1.15% |
77.61 |
|
| £65-70K |
0.68% |
0.91% |
75.13 |
|
| £70-75K |
0.52% |
0.72% |
72.78 |
|
| £75-80K |
0.41% |
0.57% |
70.56 |
|
| £80-85K |
0.32% |
0.46% |
68.45 |
|
| £85-90K |
0.25% |
0.37% |
66.45 |
|
| £90-95K |
0.20% |
0.31% |
64.56 |
|
| £95-100K |
0.16% |
0.25% |
62.76 |
|
| £100K + |
0.71% |
1.34% |
52.95 |
|
|
|

|


|
1992-1997
|
1997-2001
|
|
|
|
| Con |
-11.39% |
| Lab |
7.27% |
| LD |
3.00% |
|
| Con |
3.34% |
| Lab |
-3.39% |
| LD |
1.50% |
|
|
 |
James Purnell
Labour hold
|
| Con |
 |
8,922 |
27.84% |
| Lab |
 |
17,781 |
55.49% |
| LD |
 |
4,327 |
13.50% |
| Oth |
 |
1,016 |
3.17% |
| Maj |
 |
8,859 |
27.64% |
| Turn |
 |
32,046 |
48.36% |
|
|
 |
James Purnell
Labour hold
|
| UK |
Frank Bennett |
1,016 |
3.17% |
| LD |
Brendon Jones |
4,327 |
13.50% |
| L |
James Purnell |
17,781 |
55.49% |
| C |
Andrew Reid |
8,922 |
27.84% |
|
Candidates representing 4 parties stood for election to this seat.
|
|
 |
Tom Pendry
Labour
|
| Con |
 |
10,557 |
24.51% |
| Lab |
 |
25,363 |
58.87% |
| LD |
 |
5,169 |
12.00% |
| Ref |
 |
1,992 |
4.62% |
| Oth |
|
0 |
0.00% |
| Maj |
 |
14,806 |
34.37% |
| Turn |
 |
43,081 |
65.80% |
|
|
 |
|
Labour
|
| Con |
 |
17,708 |
35.90% |
| Lab |
 |
25,435 |
51.60% |
| LD |
 |
4,443 |
9.00% |
| Oth |
 |
1,693 |
3.40% |
| Maj |
 |
7,727 |
15.70% |
| Turn |
 |
49,279 |
73.22% |
|
|
 |
|

|

