|
Stevenage
Labour hold

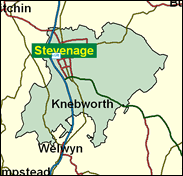
It is hard to credit that Labour's Barbara Follett actually gained this Stevenage seat as recently as 1997, when she won by over 11,500, and since Labour candidates were still over 20pc ahead of their Tory counterparts in the May 2000 borough results here (the worst year for council results for Labour for eight years). Stevenage New Town always seemed a slightly odd locus for a Conservative seat, and it would be odder still if it returned to their stewardship next time. It has always included some extraneous and Conservative villages, such as Codicote, Datchworth, Knebworth and Walkern, but it is not these which formed the basis of the Tory vote; they are not populous enough. This seat is won and lost according to the volatile, instrumental mood of the voters of Stevenage itself, the first New Town to be designated under the grand plans of the Reith Commission in the late 1940s, but still a modern and to some extent uprooted part of the world.

Barbara Follett, a Luvvie fallen from Blairite grace along with her airport-bookstall-bestselling-millionnaire-author-husband-Ken, was elected in 1997. Originator, as style and colour coordination consultant to Labour MPs, of the verb 'to Follett', she has also boosted the feminisation of the PLP by setting up Emily's List, to push female candidates. with her husband, she promoted acquisition of the Excalibur computer, used for instant rebuttal during the 1997 campaign, and staged £1,000-a-head fundraising dinners - until Blair excluded them from the inner circle. She is 58 years old going on 18, born 1942, educated in Addis Ababa and Cape Town and eventually at the LSE, and with three husbands before Ken, one of them murdered by the South African security forces. It is hard to believe that she has somehow rather sunk without trace as an MP.
 |
| Wealthy Achievers, Suburban Areas |
15.00% |
14.99% |
100.02 |
|
| Affluent Greys, Rural Communities |
0.00% |
2.13% |
0.00 |
|
| Prosperous Pensioners, Retirement Areas |
0.25% |
2.49% |
10.07 |
|
| Affluent Executives, Family Areas |
8.82% |
4.43% |
199.37 |
|
| Well-Off Workers, Family Areas |
5.46% |
7.27% |
75.08 |
|
| Affluent Urbanites, Town & City Areas |
2.10% |
2.56% |
81.80 |
|
| Prosperous Professionals, Metropolitan Areas |
1.00% |
2.04% |
49.22 |
|
| Better-Off Executives, Inner City Areas |
0.85% |
3.94% |
21.54 |
|
| Comfortable Middle Agers, Mature Home Owning Areas |
5.54% |
13.04% |
42.48 |
|
| Skilled Workers, Home Owning Areas |
14.87% |
12.70% |
117.05 |
|
| New Home Owners, Mature Communities |
7.62% |
8.14% |
93.56 |
|
| White Collar Workers, Better-Off Multi Ethnic Areas |
0.46% |
4.02% |
11.35 |
|
| Older People, Less Prosperous Areas |
5.76% |
3.19% |
180.74 |
|
| Council Estate Residents, Better-Off Homes |
30.30% |
11.31% |
267.87 |
|
| Council Estate Residents, High Unemployment |
1.53% |
3.06% |
49.97 |
|
| Council Estate Residents, Greatest Hardship |
0.45% |
2.52% |
17.83 |
|
| People in Multi-Ethnic, Low-Income Areas |
0.00% |
2.10% |
0.00 |
|
| Unclassified |
0.00% |
0.06% |
0.00 |
|
|
 |
 |
 |
| £0-5K |
7.69% |
9.41% |
81.71 |
|
| £5-10K |
14.75% |
16.63% |
88.66 |
|
| £10-15K |
15.79% |
16.58% |
95.23 |
|
| £15-20K |
13.61% |
13.58% |
100.19 |
|
| £20-25K |
10.78% |
10.39% |
103.72 |
|
| £25-30K |
8.25% |
7.77% |
106.15 |
|
| £30-35K |
6.24% |
5.79% |
107.80 |
|
| £35-40K |
4.72% |
4.33% |
108.91 |
|
| £40-45K |
3.58% |
3.27% |
109.65 |
|
| £45-50K |
2.73% |
2.48% |
110.15 |
|
| £50-55K |
2.10% |
1.90% |
110.49 |
|
| £55-60K |
1.63% |
1.47% |
110.73 |
|
| £60-65K |
1.28% |
1.15% |
110.90 |
|
| £65-70K |
1.01% |
0.91% |
111.04 |
|
| £70-75K |
0.80% |
0.72% |
111.16 |
|
| £75-80K |
0.64% |
0.57% |
111.27 |
|
| £80-85K |
0.52% |
0.46% |
111.37 |
|
| £85-90K |
0.42% |
0.37% |
111.47 |
|
| £90-95K |
0.34% |
0.31% |
111.58 |
|
| £95-100K |
0.28% |
0.25% |
111.69 |
|
| £100K + |
1.51% |
1.34% |
112.68 |
|
|
|

|


|
1992-1997
|
1997-2001
|
|
|
|
| Con |
-11.09% |
| Lab |
16.75% |
| LD |
-8.17% |
|
| Con |
-1.10% |
| Lab |
-3.46% |
| LD |
5.27% |
|
|
 |
Barbara Follett
Labour hold
|
| Con |
 |
13,459 |
31.70% |
| Lab |
 |
22,025 |
51.88% |
| LD |
 |
6,027 |
14.20% |
| Oth |
 |
942 |
2.22% |
| Maj |
 |
8,566 |
20.18% |
| Turn |
 |
42,453 |
61.35% |
|
|
 |
Barbara Follett
Labour hold
|
| P |
Sarah Bell |
173 |
0.41% |
| LD |
Harry Davies |
6,027 |
14.20% |
| L |
Barbara Follett |
22,025 |
51.88% |
| SA |
Steve Glennon |
449 |
1.06% |
| I |
Antal Losonczi |
320 |
0.75% |
| C |
Graeme Quar |
13,459 |
31.70% |
|
Candidates representing 6 parties stood for election to this seat.
|
|
 |
Barbara Follett
Labour gain
|
| Con |
 |
16,858 |
32.81% |
| Lab |
 |
28,440 |
55.35% |
| LD |
 |
4,588 |
8.93% |
| Ref |
 |
1,194 |
2.32% |
| Oth |
 |
306 |
0.60% |
| Maj |
 |
11,582 |
22.54% |
| Turn |
 |
51,386 |
76.82% |
|
|
 |
|
Conservative
|
| Con |
 |
24,078 |
43.90% |
| Lab |
 |
21,159 |
38.60% |
| LD |
 |
9,379 |
17.10% |
| Oth |
 |
220 |
0.40% |
| Maj |
 |
2,919 |
5.30% |
| Turn |
 |
54,836 |
81.83% |
|
|
 |
|

|

