|
Stirling
Labour hold

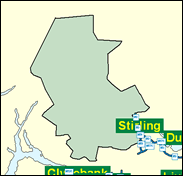
One of the seven Conservative Cabinet Ministers to be defeated in 1997 was Michael Forsyth, but he proved a dour defender of Stirling to the last. He held on by under 1,000 votes in both 1987 and 1992, and the victim of a smaller than average hostile swing of between seven and eight per cent in 1997. This was easily enough, of course, and with Forsyth gone it seems that the Tories will find it hard to recapture this seat; in the 1999 Scottish parliament elections they dropped to third place behind the SNP, and after the boundary changes which removed Bridge of Allan before 1997, reducing the territory outside Stirling itself, which is substantial in area (extending right through the Trossachs, which is painful for Labour) but not quite so much so in electorate.

Anne McGuire was elected in 1997 after selection from an all-women shortlist, and swiftly rewarded for her role on Labour's Scottish Executive in pulling the Labour Party in Scotland into step with the Blairite leadership, by being made PPS to Donald Dewar in December 1997. This was after she loyally backed the controversial lone parent benefit cuts. In 1998 she was promoted into the government as an Assistant Whip. A railwayman's daughter from Labour's West of Scotland Catholic core, she was born 1949, educated at Our Lady of St Francis Secondary School, Glasgow and Glasgow University, worked for Community Service Volunteers and the Scottish Council for Voluntary Organisations.
 |
| Wealthy Achievers, Suburban Areas |
24.22% |
14.99% |
161.50 |
|
| Affluent Greys, Rural Communities |
4.00% |
2.13% |
188.19 |
|
| Prosperous Pensioners, Retirement Areas |
1.81% |
2.49% |
72.81 |
|
| Affluent Executives, Family Areas |
8.20% |
4.43% |
185.36 |
|
| Well-Off Workers, Family Areas |
4.44% |
7.27% |
60.98 |
|
| Affluent Urbanites, Town & City Areas |
6.64% |
2.56% |
258.91 |
|
| Prosperous Professionals, Metropolitan Areas |
3.08% |
2.04% |
150.77 |
|
| Better-Off Executives, Inner City Areas |
3.45% |
3.94% |
87.43 |
|
| Comfortable Middle Agers, Mature Home Owning Areas |
6.17% |
13.04% |
47.35 |
|
| Skilled Workers, Home Owning Areas |
1.39% |
12.70% |
10.91 |
|
| New Home Owners, Mature Communities |
10.81% |
8.14% |
132.79 |
|
| White Collar Workers, Better-Off Multi Ethnic Areas |
1.20% |
4.02% |
29.85 |
|
| Older People, Less Prosperous Areas |
4.31% |
3.19% |
135.43 |
|
| Council Estate Residents, Better-Off Homes |
11.48% |
11.31% |
101.49 |
|
| Council Estate Residents, High Unemployment |
3.90% |
3.06% |
127.41 |
|
| Council Estate Residents, Greatest Hardship |
4.90% |
2.52% |
194.58 |
|
| People in Multi-Ethnic, Low-Income Areas |
0.00% |
2.10% |
0.00 |
|
| Unclassified |
0.00% |
0.06% |
0.00 |
|
|
 |
 |
 |
| £0-5K |
9.22% |
9.41% |
97.99 |
|
| £5-10K |
15.71% |
16.63% |
94.43 |
|
| £10-15K |
15.71% |
16.58% |
94.78 |
|
| £15-20K |
13.16% |
13.58% |
96.88 |
|
| £20-25K |
10.35% |
10.39% |
99.59 |
|
| £25-30K |
7.96% |
7.77% |
102.38 |
|
| £30-35K |
6.08% |
5.79% |
105.00 |
|
| £35-40K |
4.65% |
4.33% |
107.32 |
|
| £40-45K |
3.57% |
3.27% |
109.32 |
|
| £45-50K |
2.76% |
2.48% |
111.00 |
|
| £50-55K |
2.14% |
1.90% |
112.38 |
|
| £55-60K |
1.67% |
1.47% |
113.47 |
|
| £60-65K |
1.32% |
1.15% |
114.30 |
|
| £65-70K |
1.04% |
0.91% |
114.91 |
|
| £70-75K |
0.83% |
0.72% |
115.32 |
|
| £75-80K |
0.66% |
0.57% |
115.55 |
|
| £80-85K |
0.53% |
0.46% |
115.63 |
|
| £85-90K |
0.43% |
0.37% |
115.57 |
|
| £90-95K |
0.35% |
0.31% |
115.39 |
|
| £95-100K |
0.29% |
0.25% |
115.11 |
|
| £100K + |
1.49% |
1.34% |
110.62 |
|
|
|

|


|
1992-1997
|
1997-2001
|
|
|
|
| Con |
-6.68% |
| Lab |
8.85% |
| LD |
-0.47% |
| SNP |
-1.11% |
|
| Con |
-7.75% |
| Lab |
-5.21% |
| LD |
5.48% |
| SNP |
2.97% |
|
|
 |
Anne McGuire
Labour hold
|
| Con |
 |
8,901 |
24.77% |
| Lab |
 |
15,175 |
42.23% |
| LD |
 |
4,208 |
11.71% |
| SNP |
 |
5,877 |
16.36% |
| Oth |
 |
1,769 |
4.92% |
| Maj |
 |
6,274 |
17.46% |
| Turn |
 |
35,930 |
67.67% |
|
|
 |
Anne McGuire
Labour hold
|
| LD |
Clive Freeman |
4,208 |
11.71% |
| SNP |
Fiona Macaulay |
5,877 |
16.36% |
| C |
Geoff Mawdsley |
8,901 |
24.77% |
| L |
Anne McGuire |
15,175 |
42.23% |
| SSP |
Clark Mullen |
1,012 |
2.82% |
| G |
Mark Ruskell |
757 |
2.11% |
|
Candidates representing 6 parties stood for election to this seat.
|
|
 |
Anne McGuire
Labour gain
|
| Con |
 |
13,971 |
32.52% |
| Lab |
 |
20,382 |
47.45% |
| LD |
 |
2,675 |
6.23% |
| SNP |
 |
5,752 |
13.39% |
| Ref |
|
0 |
0.00% |
| Oth |
 |
178 |
0.41% |
| Maj |
 |
6,411 |
14.92% |
| Turn |
 |
42,958 |
81.84% |
|
|
 |
|
Conservative
|
| Con |
 |
16,607 |
39.20% |
| Lab |
 |
16,371 |
38.60% |
| LD |
 |
2,854 |
6.70% |
| SNP |
 |
6,145 |
14.50% |
| Oth |
 |
410 |
1.00% |
| Maj |
 |
236 |
0.60% |
| Turn |
 |
42,387 |
81.67% |
|
|
 |
|

|

