|
Birmingham, Erdington
Labour hold

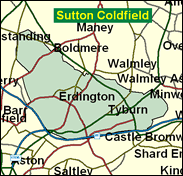
This seat in the north east part of Birmingham saw Labour outvote the Conservatives by about two to one in 1997, and recent evidence suggests that this may well continue to be the pattern. In the May 2000 local elections, when across the city as a whole the Conservatives received more votes than Labour for the first time for many years, Labour held all four wards in this seat: Erdington itself, Kingsbury, Kingstanding, and Stockland Green. Suburban but working class, this represents the Labour traditional heartland, very much on the edge of a very modern and mixed city.

From an NEC-devised shortlist, Labour have replaced retiring Robin Corbett with the ex-corpulent journalist Sion Simon. Born 1968, son of schoolteachers and educated at Handsworth Grammar School and Magdalen College, Oxford, he worked for two years as a manager with Guinness PLC, and for three years as researcher for Labour's then European spokesman, George Robertson, in the early 'nineties, but since 1997 has been a columnist of the Telegraph, Spectator and News of the World, where he has pragmatically intoned New Labour orthodoxies.
 |
| Wealthy Achievers, Suburban Areas |
0.50% |
14.99% |
3.32 |
|
| Affluent Greys, Rural Communities |
0.00% |
2.13% |
0.00 |
|
| Prosperous Pensioners, Retirement Areas |
0.00% |
2.49% |
0.00 |
|
| Affluent Executives, Family Areas |
1.28% |
4.43% |
28.86 |
|
| Well-Off Workers, Family Areas |
1.51% |
7.27% |
20.82 |
|
| Affluent Urbanites, Town & City Areas |
3.17% |
2.56% |
123.61 |
|
| Prosperous Professionals, Metropolitan Areas |
0.06% |
2.04% |
3.12 |
|
| Better-Off Executives, Inner City Areas |
3.62% |
3.94% |
91.82 |
|
| Comfortable Middle Agers, Mature Home Owning Areas |
5.91% |
13.04% |
45.32 |
|
| Skilled Workers, Home Owning Areas |
16.29% |
12.70% |
128.24 |
|
| New Home Owners, Mature Communities |
5.95% |
8.14% |
73.12 |
|
| White Collar Workers, Better-Off Multi Ethnic Areas |
7.47% |
4.02% |
185.68 |
|
| Older People, Less Prosperous Areas |
4.95% |
3.19% |
155.28 |
|
| Council Estate Residents, Better-Off Homes |
40.91% |
11.31% |
361.73 |
|
| Council Estate Residents, High Unemployment |
4.28% |
3.06% |
139.73 |
|
| Council Estate Residents, Greatest Hardship |
4.00% |
2.52% |
158.63 |
|
| People in Multi-Ethnic, Low-Income Areas |
0.00% |
2.10% |
0.00 |
|
| Unclassified |
0.10% |
0.06% |
163.14 |
|
|
 |
 |
 |
| £0-5K |
13.11% |
9.41% |
139.22 |
|
| £5-10K |
22.22% |
16.63% |
133.59 |
|
| £10-15K |
19.90% |
16.58% |
120.03 |
|
| £15-20K |
14.36% |
13.58% |
105.72 |
|
| £20-25K |
9.66% |
10.39% |
92.94 |
|
| £25-30K |
6.38% |
7.77% |
82.09 |
|
| £30-35K |
4.23% |
5.79% |
73.03 |
|
| £35-40K |
2.84% |
4.33% |
65.49 |
|
| £40-45K |
1.93% |
3.27% |
59.16 |
|
| £45-50K |
1.34% |
2.48% |
53.84 |
|
| £50-55K |
0.94% |
1.90% |
49.31 |
|
| £55-60K |
0.67% |
1.47% |
45.43 |
|
| £60-65K |
0.48% |
1.15% |
42.07 |
|
| £65-70K |
0.35% |
0.91% |
39.16 |
|
| £70-75K |
0.26% |
0.72% |
36.61 |
|
| £75-80K |
0.20% |
0.57% |
34.35 |
|
| £80-85K |
0.15% |
0.46% |
32.35 |
|
| £85-90K |
0.11% |
0.37% |
30.57 |
|
| £90-95K |
0.09% |
0.31% |
28.97 |
|
| £95-100K |
0.07% |
0.25% |
27.53 |
|
| £100K + |
0.29% |
1.34% |
21.26 |
|
|
|

|


|
1992-1997
|
1997-2001
|
|
|
|
| Con |
-9.01% |
| Lab |
5.51% |
| LD |
-0.02% |
|
| Con |
-3.27% |
| Lab |
-2.04% |
| LD |
1.59% |
|
|
 |
Sion Llewelyn Simon
Labour hold
|
| Con |
 |
7,413 |
24.22% |
| Lab |
 |
17,375 |
56.77% |
| LD |
 |
3,602 |
11.77% |
| Oth |
 |
2,214 |
7.23% |
| Maj |
 |
9,962 |
32.55% |
| Turn |
 |
30,604 |
46.60% |
|
|
 |
Sion Llewelyn Simon
Labour hold
|
| SA |
Steve Godward |
669 |
2.19% |
| LD |
Sandra Johnson |
3,602 |
11.77% |
| L |
Sion Llewelyn Simon |
17,375 |
56.77% |
| C |
Oliver Lodge |
7,413 |
24.22% |
| UK |
Mark Nattrass |
521 |
1.70% |
| SL |
Judith Sambrook-Marshall |
343 |
1.12% |
| NF |
Michael Shore |
681 |
2.23% |
|
Candidates representing 7 parties stood for election to this seat.
|
|
 |
Robin Corbett
Labour
|
| Con |
 |
11,107 |
27.49% |
| Lab |
 |
23,764 |
58.81% |
| LD |
 |
4,112 |
10.18% |
| Ref |
 |
1,424 |
3.52% |
| Oth |
|
0 |
0.00% |
| Maj |
 |
12,657 |
31.32% |
| Turn |
 |
40,407 |
60.87% |
|
|
 |
|
Labour
|
| Con |
 |
18,498 |
36.50% |
| Lab |
 |
27,021 |
53.30% |
| LD |
 |
5,187 |
10.20% |
| Oth |
|
0 |
0.00% |
| Maj |
 |
8,523 |
16.80% |
| Turn |
 |
50,706 |
67.85% |
|
|
 |
|

|

