|
Stockton North
Labour hold

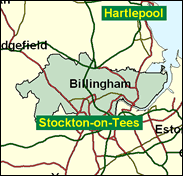
The Teesside twin town of Middlesbrough, Stockton is known for its industrial history and character. The North division is dominated physically and to some extent economically by the giant ICI works at Billingham, which is in the seat, and the Labour strength was sufficient to see off the charms of Bill Rodgers, one of the most influential of the original SDP founders, when he tried to retain his Commons seat here in 1983. Looking even further back, no remnant survives either of the sympathetic One Nation Conservatism of Harold Macmillan, MP for Stockton from 1929 to 1945, who was profoundly affected by his experience of the Depression years here - so much so that he not only took the town into his title but gave up his own name itself for that of Stockton when he belatedly entered the Lords as an Earl in 1984.

Frank Cook, as a long-time local critic, replaced SDP defector Bill Rodgers as Labour MP here in 1983. Originally a Campaign-Grouper who voted for Heffer and Meacher as a leadership team in 1983, he has since mellowed into a maverick who politically-incorrectly votes against gun control even post-Dunblane (which he blamed on "police negligence"), has an interest in defence issues dating from his time in the Parachute Regiment, and is concerned about civil and military nuclear power. Small and pink-faced, he was born in 1935, educated at Corby School, Sunderland and De la Salle (RC) College, Manchester, worked initially as a schoolteacher, and then as an engineering industry project manager. A Catholic who prefers to see himself as "an MP who is a Catholic and not a Roman Catholic who is an MP", he reflects his church's opinion on abortion.
 |
| Wealthy Achievers, Suburban Areas |
6.10% |
14.99% |
40.68 |
|
| Affluent Greys, Rural Communities |
0.00% |
2.13% |
0.00 |
|
| Prosperous Pensioners, Retirement Areas |
0.46% |
2.49% |
18.33 |
|
| Affluent Executives, Family Areas |
5.12% |
4.43% |
115.72 |
|
| Well-Off Workers, Family Areas |
10.12% |
7.27% |
139.15 |
|
| Affluent Urbanites, Town & City Areas |
0.22% |
2.56% |
8.68 |
|
| Prosperous Professionals, Metropolitan Areas |
0.00% |
2.04% |
0.00 |
|
| Better-Off Executives, Inner City Areas |
0.12% |
3.94% |
3.06 |
|
| Comfortable Middle Agers, Mature Home Owning Areas |
8.28% |
13.04% |
63.47 |
|
| Skilled Workers, Home Owning Areas |
17.13% |
12.70% |
134.88 |
|
| New Home Owners, Mature Communities |
16.92% |
8.14% |
207.79 |
|
| White Collar Workers, Better-Off Multi Ethnic Areas |
0.17% |
4.02% |
4.22 |
|
| Older People, Less Prosperous Areas |
3.55% |
3.19% |
111.32 |
|
| Council Estate Residents, Better-Off Homes |
17.94% |
11.31% |
158.65 |
|
| Council Estate Residents, High Unemployment |
2.93% |
3.06% |
95.71 |
|
| Council Estate Residents, Greatest Hardship |
10.94% |
2.52% |
434.37 |
|
| People in Multi-Ethnic, Low-Income Areas |
0.00% |
2.10% |
0.00 |
|
| Unclassified |
0.00% |
0.06% |
0.00 |
|
|
 |
 |
 |
| £0-5K |
13.86% |
9.41% |
147.28 |
|
| £5-10K |
22.35% |
16.63% |
134.36 |
|
| £10-15K |
19.19% |
16.58% |
115.76 |
|
| £15-20K |
13.65% |
13.58% |
100.51 |
|
| £20-25K |
9.25% |
10.39% |
88.98 |
|
| £25-30K |
6.24% |
7.77% |
80.27 |
|
| £30-35K |
4.26% |
5.79% |
73.53 |
|
| £35-40K |
2.95% |
4.33% |
68.19 |
|
| £40-45K |
2.08% |
3.27% |
63.82 |
|
| £45-50K |
1.49% |
2.48% |
60.17 |
|
| £50-55K |
1.09% |
1.90% |
57.05 |
|
| £55-60K |
0.80% |
1.47% |
54.34 |
|
| £60-65K |
0.60% |
1.15% |
51.94 |
|
| £65-70K |
0.45% |
0.91% |
49.80 |
|
| £70-75K |
0.34% |
0.72% |
47.87 |
|
| £75-80K |
0.27% |
0.57% |
46.11 |
|
| £80-85K |
0.21% |
0.46% |
44.50 |
|
| £85-90K |
0.16% |
0.37% |
43.02 |
|
| £90-95K |
0.13% |
0.31% |
41.66 |
|
| £95-100K |
0.10% |
0.25% |
40.39 |
|
| £100K + |
0.46% |
1.34% |
34.21 |
|
|
|

|


|
1992-1997
|
1997-2001
|
|
|
|
| Con |
-14.08% |
| Lab |
12.84% |
| LD |
-1.17% |
|
| Con |
3.26% |
| Lab |
-3.41% |
| LD |
1.05% |
|
|
 |
Frank Cook
Labour hold
|
| Con |
 |
7,823 |
22.08% |
| Lab |
 |
22,470 |
63.43% |
| LD |
 |
4,208 |
11.88% |
| Oth |
 |
926 |
2.61% |
| Maj |
 |
14,647 |
41.34% |
| Turn |
 |
35,427 |
54.34% |
|
|
 |
Frank Cook
Labour hold
|
| L |
Frank Cook |
22,470 |
63.43% |
| C |
Amanda Vigar |
7,823 |
22.08% |
| LD |
Mary Wallace |
4,208 |
11.88% |
| G |
Bill Wennington |
926 |
2.61% |
|
Candidates representing 4 parties stood for election to this seat.
|
|
 |
Frank Cook
Labour
|
| Con |
 |
8,369 |
18.82% |
| Lab |
 |
29,726 |
66.84% |
| LD |
 |
4,816 |
10.83% |
| Ref |
 |
1,563 |
3.51% |
| Oth |
|
0 |
0.00% |
| Maj |
 |
21,357 |
48.02% |
| Turn |
 |
44,474 |
69.08% |
|
|
 |
|
Labour
|
| Con |
 |
16,666 |
32.90% |
| Lab |
 |
27,332 |
54.00% |
| LD |
 |
6,060 |
12.00% |
| Oth |
 |
550 |
1.10% |
| Maj |
 |
10,666 |
21.10% |
| Turn |
 |
50,608 |
75.77% |
|
|
 |
|

|

