|
Stoke-on-Trent Central
Labour hold

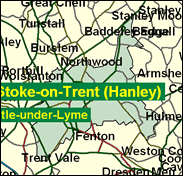
The Potteries is fairly unrelievedly working class and Labour in nature. There are few regular Conservative wards here, and no sniff of a Tory parliamentary victory, although they did make some council gains in 2000, when Labour was also plagued by Independent and some Liberal Democrat successes for local reasons, but all three Stoke seats rank in ten 14 most working class in the whole of Britain, Central in 6th place. The reason for this probably lies not only in the economic base of skilled manual industries, but also in Stoke on Trent's well known configuration as a federation of small towns (written up by Arnold Bennett) such as, here, Stoke itself and Hanley, along with other neighbourhoods like Etruria, Shelton and Hartshill, and the peripheral council estates of Brookhouse and Abbey. These are not big enough to build up substantial middle class areas, which are in any case more likely to be found in Newcastle under Lyme, and further afield still. It all adds up to a trio of safe Labour seats.

Mark Fisher, dropped in the first reshuffle in 1998 as Arts Minister, is one of Labour's more exotic blooms, as the son of a former Tory MP, and as one the PLP's two Old Etonians (to add to the eight who have gone before). A Friar Tuck look-alike with shiny bald pate, though preferring comparison with Humpty-Dumpty, he was born 1944 and after Eton attended Trinity College, Cambridge. Such a background making it prudent to act Left, he duly joined the Campaign Group on election for Stoke Central in 1983. His patrician voice and film industry interests made him an ideal choice for Arts spokesman from 1987, but his interest in freedom of information involved him in a clash with Irvine, Straw and Mandelson in 1998, just prior to his ministerial exit. Subsequently he has rebelled on incapacity benefit cuts, legal aid curbs, pensions, and freedom of information.
 |
| Wealthy Achievers, Suburban Areas |
1.77% |
14.99% |
11.83 |
|
| Affluent Greys, Rural Communities |
0.21% |
2.13% |
9.69 |
|
| Prosperous Pensioners, Retirement Areas |
0.00% |
2.49% |
0.00 |
|
| Affluent Executives, Family Areas |
0.18% |
4.43% |
4.17 |
|
| Well-Off Workers, Family Areas |
7.78% |
7.27% |
106.95 |
|
| Affluent Urbanites, Town & City Areas |
0.01% |
2.56% |
0.37 |
|
| Prosperous Professionals, Metropolitan Areas |
0.00% |
2.04% |
0.00 |
|
| Better-Off Executives, Inner City Areas |
6.80% |
3.94% |
172.55 |
|
| Comfortable Middle Agers, Mature Home Owning Areas |
2.71% |
13.04% |
20.76 |
|
| Skilled Workers, Home Owning Areas |
33.52% |
12.70% |
263.84 |
|
| New Home Owners, Mature Communities |
13.06% |
8.14% |
160.36 |
|
| White Collar Workers, Better-Off Multi Ethnic Areas |
3.21% |
4.02% |
79.73 |
|
| Older People, Less Prosperous Areas |
3.20% |
3.19% |
100.51 |
|
| Council Estate Residents, Better-Off Homes |
23.14% |
11.31% |
204.59 |
|
| Council Estate Residents, High Unemployment |
2.11% |
3.06% |
69.00 |
|
| Council Estate Residents, Greatest Hardship |
1.24% |
2.52% |
49.39 |
|
| People in Multi-Ethnic, Low-Income Areas |
1.04% |
2.10% |
49.71 |
|
| Unclassified |
0.01% |
0.06% |
20.89 |
|
|
 |
 |
 |
| £0-5K |
15.14% |
9.41% |
160.79 |
|
| £5-10K |
25.05% |
16.63% |
150.63 |
|
| £10-15K |
21.05% |
16.58% |
126.98 |
|
| £15-20K |
14.22% |
13.58% |
104.72 |
|
| £20-25K |
8.97% |
10.39% |
86.30 |
|
| £25-30K |
5.56% |
7.77% |
71.49 |
|
| £30-35K |
3.45% |
5.79% |
59.62 |
|
| £35-40K |
2.17% |
4.33% |
50.08 |
|
| £40-45K |
1.38% |
3.27% |
42.38 |
|
| £45-50K |
0.90% |
2.48% |
36.11 |
|
| £50-55K |
0.59% |
1.90% |
30.99 |
|
| £55-60K |
0.39% |
1.47% |
26.77 |
|
| £60-65K |
0.27% |
1.15% |
23.27 |
|
| £65-70K |
0.18% |
0.91% |
20.35 |
|
| £70-75K |
0.13% |
0.72% |
17.90 |
|
| £75-80K |
0.09% |
0.57% |
15.83 |
|
| £80-85K |
0.07% |
0.46% |
14.07 |
|
| £85-90K |
0.05% |
0.37% |
12.57 |
|
| £90-95K |
0.03% |
0.31% |
11.28 |
|
| £95-100K |
0.03% |
0.25% |
10.16 |
|
| £100K + |
0.08% |
1.34% |
6.14 |
|
|
|

|


|
1992-1997
|
1997-2001
|
|
|
|
| Con |
-11.16% |
| Lab |
8.25% |
| LD |
-1.65% |
|
| Con |
2.07% |
| Lab |
-5.58% |
| LD |
2.71% |
|
|
 |
Mark Fisher
Labour hold
|
| Con |
 |
5,325 |
18.82% |
| Lab |
 |
17,170 |
60.67% |
| LD |
 |
4,148 |
14.66% |
| Oth |
 |
1,657 |
5.86% |
| Maj |
 |
11,845 |
41.86% |
| Turn |
 |
28,300 |
47.36% |
|
|
 |
Mark Fisher
Labour hold
|
| C |
Jill Clark |
5,325 |
18.82% |
| L |
Mark Fisher |
17,170 |
60.67% |
| LD |
Gavin Webb |
4,148 |
14.66% |
| I |
Richard Wise |
1,657 |
5.86% |
|
Candidates representing 4 parties stood for election to this seat.
|
|
 |
Mark Fisher
Labour
|
| Con |
 |
6,738 |
16.74% |
| Lab |
 |
26,662 |
66.25% |
| LD |
 |
4,809 |
11.95% |
| Ref |
 |
1,071 |
2.66% |
| Oth |
 |
965 |
2.40% |
| Maj |
 |
19,924 |
49.51% |
| Turn |
 |
40,245 |
62.77% |
|
|
 |
|
Labour
|
| Con |
 |
12,477 |
27.90% |
| Lab |
 |
25,897 |
58.00% |
| LD |
 |
6,073 |
13.60% |
| Oth |
 |
196 |
0.40% |
| Maj |
 |
13,420 |
30.10% |
| Turn |
 |
44,643 |
67.87% |
|
|
 |
|

|

