|
Stoke-on-Trent South
Labour hold

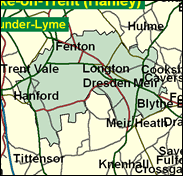
The Potteries is fairly unrelievedly working class and Labour in nature. There are few regular Conservative wards here, and no sniff of a Tory parliamentary victory, although they did make some council gains in 2000, when Labour was also plagued by Independent and some Liberal Democrat successes for local reasons, but all three Stoke seats rank in the 14 most working class in the whole of Britain, Central in 6th place. The reason for this probably lies not only in the economic base of skilled manual industries, but also in Stoke on Trent's well known configuration as a federation of small towns (written up by Arnold Bennett) such as, here, Longton and Fenton and the peripheral council estates of Meir Green and Blurton. These are not big enough to build up substantial middle class areas, although the one reliably Conservative ward in the whole of Stoke, Trentham Park, is here; South has been the least monolithic of the trio of safe Labour seats.

George Stevenson, Labour MP here since 1992, comes with impeccable if rare working class credentials as a former bus driver, pottery worker and miner, and miner's son. Born in the Yorkshire coalfield in 1938, he was educated at Queensbury Road Secondary Modern, Stoke, and reached the Commons after 14 years on Stoke City Council and ten years in the European Parliament. Dark and stocky, he protests at defective rail transport, and has rebelled on the pensions link to average earnings, disability benefit cuts and air traffic control privatisation. Less parochially he attacks the Chinese occupation of Tibet, as secure a business as Labour's occupation since 1935 of Stoke South.
 |
| Wealthy Achievers, Suburban Areas |
3.26% |
14.99% |
21.75 |
|
| Affluent Greys, Rural Communities |
0.00% |
2.13% |
0.00 |
|
| Prosperous Pensioners, Retirement Areas |
0.01% |
2.49% |
0.21 |
|
| Affluent Executives, Family Areas |
9.49% |
4.43% |
214.47 |
|
| Well-Off Workers, Family Areas |
11.64% |
7.27% |
160.05 |
|
| Affluent Urbanites, Town & City Areas |
0.00% |
2.56% |
0.00 |
|
| Prosperous Professionals, Metropolitan Areas |
0.00% |
2.04% |
0.00 |
|
| Better-Off Executives, Inner City Areas |
0.00% |
3.94% |
0.00 |
|
| Comfortable Middle Agers, Mature Home Owning Areas |
5.89% |
13.04% |
45.16 |
|
| Skilled Workers, Home Owning Areas |
35.07% |
12.70% |
276.05 |
|
| New Home Owners, Mature Communities |
13.52% |
8.14% |
166.08 |
|
| White Collar Workers, Better-Off Multi Ethnic Areas |
0.04% |
4.02% |
0.87 |
|
| Older People, Less Prosperous Areas |
2.99% |
3.19% |
93.98 |
|
| Council Estate Residents, Better-Off Homes |
15.79% |
11.31% |
139.59 |
|
| Council Estate Residents, High Unemployment |
0.43% |
3.06% |
14.17 |
|
| Council Estate Residents, Greatest Hardship |
1.87% |
2.52% |
74.29 |
|
| People in Multi-Ethnic, Low-Income Areas |
0.00% |
2.10% |
0.00 |
|
| Unclassified |
0.00% |
0.06% |
0.00 |
|
|
 |
 |
 |
| £0-5K |
11.87% |
9.41% |
126.09 |
|
| £5-10K |
22.00% |
16.63% |
132.29 |
|
| £10-15K |
20.31% |
16.58% |
122.49 |
|
| £15-20K |
14.84% |
13.58% |
109.23 |
|
| £20-25K |
10.02% |
10.39% |
96.39 |
|
| £25-30K |
6.62% |
7.77% |
85.10 |
|
| £30-35K |
4.37% |
5.79% |
75.50 |
|
| £35-40K |
2.92% |
4.33% |
67.44 |
|
| £40-45K |
1.98% |
3.27% |
60.68 |
|
| £45-50K |
1.36% |
2.48% |
54.98 |
|
| £50-55K |
0.95% |
1.90% |
50.14 |
|
| £55-60K |
0.68% |
1.47% |
46.01 |
|
| £60-65K |
0.49% |
1.15% |
42.44 |
|
| £65-70K |
0.36% |
0.91% |
39.34 |
|
| £70-75K |
0.26% |
0.72% |
36.62 |
|
| £75-80K |
0.20% |
0.57% |
34.22 |
|
| £80-85K |
0.15% |
0.46% |
32.08 |
|
| £85-90K |
0.11% |
0.37% |
30.16 |
|
| £90-95K |
0.09% |
0.31% |
28.44 |
|
| £95-100K |
0.07% |
0.25% |
26.87 |
|
| £100K + |
0.27% |
1.34% |
19.85 |
|
|
|

|


|
1992-1997
|
1997-2001
|
|
|
|
| Con |
-14.33% |
| Lab |
12.15% |
| LD |
-2.81% |
|
| Con |
3.24% |
| Lab |
-6.10% |
| LD |
3.44% |
|
|
 |
George Stevenson
Labour hold
|
| Con |
 |
8,877 |
25.60% |
| Lab |
 |
19,366 |
55.86% |
| LD |
 |
4,724 |
13.63% |
| Oth |
 |
1,703 |
4.91% |
| Maj |
 |
10,489 |
30.25% |
| Turn |
 |
34,670 |
49.51% |
|
|
 |
George Stevenson
Labour hold
|
| C |
Philip Bastiman |
8,877 |
25.60% |
| LD |
Christopher Coleman |
4,724 |
13.63% |
| I |
Adrian Knapper |
1,703 |
4.91% |
| L |
George Stevenson |
19,366 |
55.86% |
|
Candidates representing 4 parties stood for election to this seat.
|
|
 |
George Stevenson
Labour
|
| Con |
 |
10,342 |
22.37% |
| Lab |
 |
28,645 |
61.95% |
| LD |
 |
4,710 |
10.19% |
| Ref |
 |
1,103 |
2.39% |
| Oth |
 |
1,436 |
3.11% |
| Maj |
 |
18,303 |
39.59% |
| Turn |
 |
46,236 |
66.08% |
|
|
 |
|
Labour
|
| Con |
 |
19,471 |
36.70% |
| Lab |
 |
26,380 |
49.80% |
| LD |
 |
6,870 |
13.00% |
| Oth |
 |
291 |
0.50% |
| Maj |
 |
6,909 |
13.00% |
| Turn |
 |
53,012 |
73.47% |
|
|
 |
|

|

