|
Stone
Conservative hold

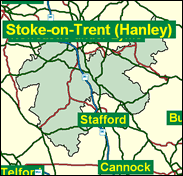
Although it is not clear that Referendum and UK Independence Party candidates actually cost the Conservatives more than a handful of seats in 1997, their absence where the Tory MP is known for his or her opposition to further European integration undoubtedly made a few incumbents breathe a little easier as their colleagues were going down like ninepins on Mayday 1997. One of these was Bill Cash of Stone in mid Staffordshire, who held on by just 7pc on a swing which was slightly below the national average. Cash still looks isolated even in his party as at present constituted, but he should hold on again in Stone, which consists of a broad swathe of countryside with no towns apart from Stone itself, population 12,000, and Gnosall and Eccleshall, which are scarcely more than large villages at between 4,000 and 5,000.

Bill Cash, his party's leading Maastricht Eurosceptic and scourge of the federasts, was elected MP for Stafford in 1984 and for this seat in 1997. Voting against Maastricht 47 times, he toned down from outright defiance to abstention in the run-up to gaining reselection in the much changed map of Staffordshire seats. An immensely tall and earnest solicitor wrapped in a conspicuous pin stripe, he is an outsider as a Catholic (born 1940, educated at Stonyhurst and Lincoln College, Oxford) with a Quaker father (killed in action near Caen in 1944), and a sense that "we were definitely not part of the Establishment". He backed Redwood, then Hague, in 1997.
 |
| Wealthy Achievers, Suburban Areas |
34.61% |
14.99% |
230.83 |
|
| Affluent Greys, Rural Communities |
1.60% |
2.13% |
75.17 |
|
| Prosperous Pensioners, Retirement Areas |
0.18% |
2.49% |
7.09 |
|
| Affluent Executives, Family Areas |
9.96% |
4.43% |
225.08 |
|
| Well-Off Workers, Family Areas |
8.53% |
7.27% |
117.32 |
|
| Affluent Urbanites, Town & City Areas |
0.00% |
2.56% |
0.00 |
|
| Prosperous Professionals, Metropolitan Areas |
0.00% |
2.04% |
0.00 |
|
| Better-Off Executives, Inner City Areas |
0.00% |
3.94% |
0.00 |
|
| Comfortable Middle Agers, Mature Home Owning Areas |
25.63% |
13.04% |
196.58 |
|
| Skilled Workers, Home Owning Areas |
8.05% |
12.70% |
63.33 |
|
| New Home Owners, Mature Communities |
6.84% |
8.14% |
84.03 |
|
| White Collar Workers, Better-Off Multi Ethnic Areas |
0.67% |
4.02% |
16.70 |
|
| Older People, Less Prosperous Areas |
1.58% |
3.19% |
49.67 |
|
| Council Estate Residents, Better-Off Homes |
2.00% |
11.31% |
17.65 |
|
| Council Estate Residents, High Unemployment |
0.13% |
3.06% |
4.22 |
|
| Council Estate Residents, Greatest Hardship |
0.22% |
2.52% |
8.90 |
|
| People in Multi-Ethnic, Low-Income Areas |
0.00% |
2.10% |
0.00 |
|
| Unclassified |
0.00% |
0.06% |
0.00 |
|
|
 |
|
|
| £0-5K |
6.11% |
9.41% |
64.87 |
|
| £5-10K |
13.38% |
16.63% |
80.43 |
|
| £10-15K |
15.39% |
16.58% |
92.83 |
|
| £15-20K |
13.93% |
13.58% |
102.58 |
|
| £20-25K |
11.42% |
10.39% |
109.89 |
|
| £25-30K |
8.95% |
7.77% |
115.18 |
|
| £30-35K |
6.89% |
5.79% |
118.87 |
|
| £35-40K |
5.26% |
4.33% |
121.32 |
|
| £40-45K |
4.01% |
3.27% |
122.84 |
|
| £45-50K |
3.07% |
2.48% |
123.67 |
|
| £50-55K |
2.36% |
1.90% |
123.98 |
|
| £55-60K |
1.83% |
1.47% |
123.92 |
|
| £60-65K |
1.42% |
1.15% |
123.57 |
|
| £65-70K |
1.12% |
0.91% |
123.03 |
|
| £70-75K |
0.88% |
0.72% |
122.34 |
|
| £75-80K |
0.70% |
0.57% |
121.54 |
|
| £80-85K |
0.56% |
0.46% |
120.67 |
|
| £85-90K |
0.45% |
0.37% |
119.76 |
|
| £90-95K |
0.36% |
0.31% |
118.81 |
|
| £95-100K |
0.29% |
0.25% |
117.85 |
|
| £100K + |
1.49% |
1.34% |
111.20 |
|
|
|
|


|
1992-1997
|
1997-2001
|
|
|
|
| Con |
-9.16% |
| Lab |
10.74% |
| LD |
-1.56% |
|
| Con |
2.23% |
| Lab |
-3.80% |
| LD |
3.05% |
|
|
|
William Cash
Conservative hold
|
| Con |
 |
22,395 |
49.07% |
| Lab |
 |
16,359 |
35.84% |
| LD |
 |
6,888 |
15.09% |
| Oth |
|
0 |
0.00% |
| Maj |
 |
6,036 |
13.22% |
| Turn |
|
45,642 |
66.29% |
|
|
|
William Cash
Conservative hold
|
| C |
William Cash |
22,395 |
49.07% |
| LD |
Brendan McKeown |
6,888 |
15.09% |
| L |
John Palfreyman |
16,359 |
35.84% |
|
Candidates representing 3 parties stood for election to this seat.
|
|
|
William Cash
Conservative
|
| Con |
|
24,859 |
46.84% |
| Lab |
|
21,041 |
39.64% |
| LD |
|
6,392 |
12.04% |
| Ref |
|
0 |
0.00% |
| Oth |
 |
782 |
1.47% |
| Maj |
|
3,818 |
7.19% |
| Turn |
|
53,074 |
77.77% |
|
|
|
|
Conservative
|
| Con |
|
31,156 |
56.00% |
| Lab |
|
16,077 |
28.90% |
| LD |
|
7,554 |
13.60% |
| Oth |
|
854 |
1.50% |
| Maj |
|
15,079 |
27.10% |
| Turn |
|
55,641 |
83.76% |
|
|
|
|
|