|
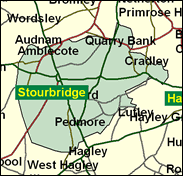
Stourbridge
Labour hold

The West Midlands returned some of Labour's worst results in the May 2000 local elections, and this very definitely included the Borough of Dudley, where there was a 21pc swing to the Tories since 1996, the highest figure of any Metropolitan Borough. Stourbridge is the strongest Tory area in that borough, indeed retaining many characteristics of its Worcestershire origins, and the Conservative candidates outpolled Labour by 18pc in 2000. This gives the new Tory parliamentary hopeful Stephen Eyre a very realistic chance of ending Debra Shipley's four year span in the Commons - although we should be careful not to place all our predictive weight on recent local election evidence.

Debra Shipley, elected in 1997 after selection from an all-women shortlist, is one of the Blair's Babes who took to producing babes of her own after the election, if discreet about all aspects of her family relationships. Born 1957 and educated at Kidderminster High School, Oxford Polytechnic and London University, she previously worked on "course development" at the University of Central England. As an MP she has majored in child abuse (with her Protection of Children Act in 1999) and environmental pollution, raising in February this year the issue of radiation from mobile phone masts. This drew from the Tory MP Michael Fabricant the response that such masts had an effect equivalent to a 50 watt light bulb.
 |
| Wealthy Achievers, Suburban Areas |
19.11% |
14.99% |
127.48 |
|
| Affluent Greys, Rural Communities |
0.00% |
2.13% |
0.00 |
|
| Prosperous Pensioners, Retirement Areas |
0.75% |
2.49% |
30.11 |
|
| Affluent Executives, Family Areas |
9.80% |
4.43% |
221.50 |
|
| Well-Off Workers, Family Areas |
14.73% |
7.27% |
202.53 |
|
| Affluent Urbanites, Town & City Areas |
0.60% |
2.56% |
23.47 |
|
| Prosperous Professionals, Metropolitan Areas |
0.00% |
2.04% |
0.00 |
|
| Better-Off Executives, Inner City Areas |
0.00% |
3.94% |
0.00 |
|
| Comfortable Middle Agers, Mature Home Owning Areas |
11.95% |
13.04% |
91.63 |
|
| Skilled Workers, Home Owning Areas |
12.31% |
12.70% |
96.91 |
|
| New Home Owners, Mature Communities |
14.33% |
8.14% |
176.00 |
|
| White Collar Workers, Better-Off Multi Ethnic Areas |
0.05% |
4.02% |
1.31 |
|
| Older People, Less Prosperous Areas |
4.78% |
3.19% |
150.04 |
|
| Council Estate Residents, Better-Off Homes |
10.04% |
11.31% |
88.80 |
|
| Council Estate Residents, High Unemployment |
1.25% |
3.06% |
40.85 |
|
| Council Estate Residents, Greatest Hardship |
0.29% |
2.52% |
11.32 |
|
| People in Multi-Ethnic, Low-Income Areas |
0.00% |
2.10% |
0.00 |
|
| Unclassified |
0.00% |
0.06% |
0.00 |
|
|
 |
 |
 |
| £0-5K |
9.13% |
9.41% |
97.01 |
|
| £5-10K |
16.32% |
16.63% |
98.13 |
|
| £10-15K |
16.84% |
16.58% |
101.55 |
|
| £15-20K |
14.11% |
13.58% |
103.89 |
|
| £20-25K |
10.89% |
10.39% |
104.75 |
|
| £25-30K |
8.12% |
7.77% |
104.40 |
|
| £30-35K |
5.98% |
5.79% |
103.22 |
|
| £35-40K |
4.40% |
4.33% |
101.54 |
|
| £40-45K |
3.25% |
3.27% |
99.58 |
|
| £45-50K |
2.42% |
2.48% |
97.52 |
|
| £50-55K |
1.82% |
1.90% |
95.45 |
|
| £55-60K |
1.38% |
1.47% |
93.43 |
|
| £60-65K |
1.05% |
1.15% |
91.50 |
|
| £65-70K |
0.81% |
0.91% |
89.67 |
|
| £70-75K |
0.63% |
0.72% |
87.96 |
|
| £75-80K |
0.50% |
0.57% |
86.35 |
|
| £80-85K |
0.39% |
0.46% |
84.85 |
|
| £85-90K |
0.31% |
0.37% |
83.45 |
|
| £90-95K |
0.25% |
0.31% |
82.15 |
|
| £95-100K |
0.20% |
0.25% |
80.93 |
|
| £100K + |
1.00% |
1.34% |
74.66 |
|
|
|

|


|
1992-1997
|
1997-2001
|
|
|
|
| Con |
-12.97% |
| Lab |
8.89% |
| LD |
2.53% |
|
| Con |
1.77% |
| Lab |
-0.04% |
| LD |
-2.23% |
|
|
 |
Debra Shipley
Labour hold
|
| Con |
 |
15,011 |
37.60% |
| Lab |
 |
18,823 |
47.15% |
| LD |
 |
4,833 |
12.11% |
| Oth |
 |
1,257 |
3.15% |
| Maj |
 |
3,812 |
9.55% |
| Turn |
 |
39,924 |
61.79% |
|
|
 |
Debra Shipley
Labour hold
|
| SL |
Mick Atherton |
494 |
1.24% |
| LD |
Chris Bramall |
4,833 |
12.11% |
| C |
Stephen Eyre |
15,011 |
37.60% |
| UK |
John Knotts |
763 |
1.91% |
| L |
Debra Shipley |
18,823 |
47.15% |
|
Candidates representing 5 parties stood for election to this seat.
|
|
 |
Debra Shipley
Labour gain
|
| Con |
 |
17,807 |
35.83% |
| Lab |
 |
23,452 |
47.19% |
| LD |
 |
7,123 |
14.33% |
| Ref |
 |
1,319 |
2.65% |
| Oth |
|
0 |
0.00% |
| Maj |
 |
5,645 |
11.36% |
| Turn |
 |
49,701 |
76.50% |
|
|
 |
|
Conservative
|
| Con |
 |
24,907 |
48.80% |
| Lab |
 |
19,519 |
38.30% |
| LD |
 |
6,011 |
11.80% |
| Oth |
 |
566 |
1.10% |
| Maj |
 |
5,388 |
10.60% |
| Turn |
 |
51,003 |
77.34% |
|
|
 |
|

|

