|
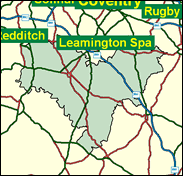
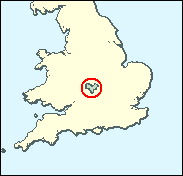
Stratford on Avon
Conservative hold

One of the safest Consevative seats is the refuge of the former Lewisham MP John Maples, following the defection of Alan Howarth to Labour and subsequent migration to Newport East in South Wales. Both will find their new seats much more comfortable. Stratford is not very large as a town despite its worldwide renown as the birthplace of the man who may have written some terrific plays while he was in London, and this constituency in fact spreads over the lush countryside of the southern half of Warwickshire, fringing the Cotswolds and including some deeply conservative small towns and villages. The Conservatives out-vote the Liberal Democrats by a fair margin in local elections and a very large margin in general elections. There were surprising newspaper reports in the 1970s that the little town of Southam harboured the British headquarters of the Ku Klux Klan, but no sightings of fiery crosses more recently.

John Maples, first elected for Lewisham West (1983-92) was returned here in 1997 as a replacement for the floor-crossing Alan Howarth. A Europhile wet who trimmed rightwards, but insufficiently, he was dropped from William Hague's front bench in 2000, after three years as successively Shadow Health, Defence and Foreign Secretaries, his earlier ministerial career under John Major (as a junior Treasury Minister) having ended with his defeat in the 1992 election. Born 1943, educated at Marlborough, Downing College Cambridge and the Inns of Court, and with a lawyer-turned-PR-man's ability smoothly to argue a brief, and dubbed "so smooth he could make a good wine waiter" (Observer), he nevertheless as Deputy Party Chairman in 1994 blurted out the awful truth about the unpopularity of the Major Government in a leaked memo.
 |
| Wealthy Achievers, Suburban Areas |
38.14% |
14.99% |
254.40 |
|
| Affluent Greys, Rural Communities |
2.30% |
2.13% |
108.30 |
|
| Prosperous Pensioners, Retirement Areas |
3.82% |
2.49% |
153.71 |
|
| Affluent Executives, Family Areas |
4.76% |
4.43% |
107.66 |
|
| Well-Off Workers, Family Areas |
10.80% |
7.27% |
148.47 |
|
| Affluent Urbanites, Town & City Areas |
0.00% |
2.56% |
0.00 |
|
| Prosperous Professionals, Metropolitan Areas |
0.00% |
2.04% |
0.00 |
|
| Better-Off Executives, Inner City Areas |
0.81% |
3.94% |
20.56 |
|
| Comfortable Middle Agers, Mature Home Owning Areas |
19.57% |
13.04% |
150.06 |
|
| Skilled Workers, Home Owning Areas |
4.24% |
12.70% |
33.40 |
|
| New Home Owners, Mature Communities |
8.01% |
8.14% |
98.31 |
|
| White Collar Workers, Better-Off Multi Ethnic Areas |
1.41% |
4.02% |
35.04 |
|
| Older People, Less Prosperous Areas |
2.57% |
3.19% |
80.61 |
|
| Council Estate Residents, Better-Off Homes |
3.50% |
11.31% |
30.95 |
|
| Council Estate Residents, High Unemployment |
0.04% |
3.06% |
1.26 |
|
| Council Estate Residents, Greatest Hardship |
0.00% |
2.52% |
0.00 |
|
| People in Multi-Ethnic, Low-Income Areas |
0.00% |
2.10% |
0.00 |
|
| Unclassified |
0.03% |
0.06% |
42.82 |
|
|
 |
|
|
| £0-5K |
6.88% |
9.41% |
73.05 |
|
| £5-10K |
12.83% |
16.63% |
77.15 |
|
| £10-15K |
14.26% |
16.58% |
86.02 |
|
| £15-20K |
12.90% |
13.58% |
94.97 |
|
| £20-25K |
10.71% |
10.39% |
103.05 |
|
| £25-30K |
8.56% |
7.77% |
110.08 |
|
| £30-35K |
6.73% |
5.79% |
116.13 |
|
| £35-40K |
5.26% |
4.33% |
121.36 |
|
| £40-45K |
4.11% |
3.27% |
125.89 |
|
| £45-50K |
3.22% |
2.48% |
129.87 |
|
| £50-55K |
2.54% |
1.90% |
133.39 |
|
| £55-60K |
2.01% |
1.47% |
136.55 |
|
| £60-65K |
1.61% |
1.15% |
139.43 |
|
| £65-70K |
1.29% |
0.91% |
142.07 |
|
| £70-75K |
1.04% |
0.72% |
144.52 |
|
| £75-80K |
0.84% |
0.57% |
146.83 |
|
| £80-85K |
0.69% |
0.46% |
149.01 |
|
| £85-90K |
0.57% |
0.37% |
151.09 |
|
| £90-95K |
0.47% |
0.31% |
153.08 |
|
| £95-100K |
0.39% |
0.25% |
155.01 |
|
| £100K + |
2.26% |
1.34% |
167.78 |
|
|
|
|


|
1992-1997
|
1997-2001
|
|
|
|
| Con |
-10.54% |
| Lab |
7.14% |
| LD |
-0.06% |
|
| Con |
2.01% |
| Lab |
-3.85% |
| LD |
3.24% |
|
|
|
John Maples
Conservative hold
|
| Con |
 |
27,606 |
50.27% |
| Lab |
 |
9,164 |
16.69% |
| LD |
 |
15,804 |
28.78% |
| Oth |
 |
2,340 |
4.26% |
| Maj |
 |
11,802 |
21.49% |
| Turn |
|
54,914 |
64.42% |
|
|
|
John Maples
Conservative hold
|
| G |
Mick Davies |
1,156 |
2.11% |
| L |
Mushtaq Hussain |
9,164 |
16.69% |
| LD |
Susan Juned |
15,804 |
28.78% |
| C |
John Maples |
27,606 |
50.27% |
| UK |
Ronald Mole |
1,184 |
2.16% |
|
Candidates representing 5 parties stood for election to this seat.
|
|
|
John Maples
Conservative
|
| Con |
|
29,967 |
48.26% |
| Lab |
|
12,754 |
20.54% |
| LD |
|
15,861 |
25.54% |
| Ref |
 |
2,064 |
3.32% |
| Oth |
|
1,453 |
2.34% |
| Maj |
|
14,106 |
22.72% |
| Turn |
|
62,099 |
76.26% |
|
|
|
|
Conservative
|
| Con |
|
37,252 |
58.80% |
| Lab |
|
8,512 |
13.40% |
| LD |
|
16,247 |
25.60% |
| Oth |
|
1,337 |
2.10% |
| Maj |
|
21,005 |
33.20% |
| Turn |
|
63,348 |
81.80% |
|
|
|
|
|