|
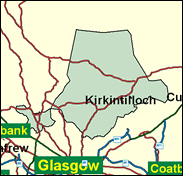
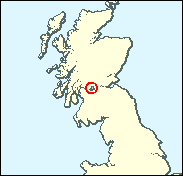
Strathkelvin and Bearsden
Labour hold

Only in Scotland, surely, could one of the most middle class towns in the whole of Britain, Bearsden, lie in a safely Labour seat; and the Strathkelvin element of Bishopbriggs and Kirkintilloch is far from standard issue central Scotland working class either. Overall, 43pc of the working population here are in professional and managerial occupations and over 70pc employed in non-manual pursuits. The solid gritstone mansions of Bearsden could scarcely look less substantial, especially when contrasted with the peripheral Glasgow estate of Drumchapel in Anniesland constituency just a couple of miles away. Yet the Tories now seem to appear irredeemably English to the Scots, and far too left wing for a taste approving of state intervention even if not personally benefiting from it, as is the case here. Sam Galbraith always seemed an ideal MP here since he seized the seat from the Tories' Michael Hirst in 1987 - as a brain surgeon he counts as a public sector caring professional - and on his migration to the Scottish Parliament he held this seat with one of Labour's most comfortable majorities, to take a couple of senior positions on the Executive after its formation in 1999. The SNP finished a distant second and the Tories a still more distant third. Galbraith undoubtedly had a personal vote; but not enough for this gap to be made up.

John Lyons, a UNISON officer, has replaced retiring Sam Galbraith. Born 1949 and educated at Woodside Secondary School, Glasgow, and Stirling University, he worked as a mechanical engineer from 1970 to 1988. Reflecting Labour's still important union links, he lists employment, and employment rights among his main interests.
 |
| Wealthy Achievers, Suburban Areas |
22.92% |
14.99% |
152.84 |
|
| Affluent Greys, Rural Communities |
0.00% |
2.13% |
0.00 |
|
| Prosperous Pensioners, Retirement Areas |
1.99% |
2.49% |
79.87 |
|
| Affluent Executives, Family Areas |
7.89% |
4.43% |
178.33 |
|
| Well-Off Workers, Family Areas |
18.55% |
7.27% |
255.08 |
|
| Affluent Urbanites, Town & City Areas |
2.41% |
2.56% |
94.15 |
|
| Prosperous Professionals, Metropolitan Areas |
0.88% |
2.04% |
43.00 |
|
| Better-Off Executives, Inner City Areas |
3.90% |
3.94% |
98.85 |
|
| Comfortable Middle Agers, Mature Home Owning Areas |
9.58% |
13.04% |
73.48 |
|
| Skilled Workers, Home Owning Areas |
5.53% |
12.70% |
43.50 |
|
| New Home Owners, Mature Communities |
4.53% |
8.14% |
55.59 |
|
| White Collar Workers, Better-Off Multi Ethnic Areas |
0.64% |
4.02% |
15.82 |
|
| Older People, Less Prosperous Areas |
2.53% |
3.19% |
79.40 |
|
| Council Estate Residents, Better-Off Homes |
10.11% |
11.31% |
89.36 |
|
| Council Estate Residents, High Unemployment |
4.71% |
3.06% |
153.93 |
|
| Council Estate Residents, Greatest Hardship |
3.41% |
2.52% |
135.27 |
|
| People in Multi-Ethnic, Low-Income Areas |
0.44% |
2.10% |
20.78 |
|
| Unclassified |
0.00% |
0.06% |
0.00 |
|
|
 |
|
|
| £0-5K |
5.68% |
9.41% |
60.31 |
|
| £5-10K |
11.87% |
16.63% |
71.36 |
|
| £10-15K |
14.03% |
16.58% |
84.65 |
|
| £15-20K |
13.34% |
13.58% |
98.22 |
|
| £20-25K |
11.47% |
10.39% |
110.37 |
|
| £25-30K |
9.35% |
7.77% |
120.31 |
|
| £30-35K |
7.41% |
5.79% |
127.93 |
|
| £35-40K |
5.78% |
4.33% |
133.48 |
|
| £40-45K |
4.48% |
3.27% |
137.31 |
|
| £45-50K |
3.47% |
2.48% |
139.77 |
|
| £50-55K |
2.69% |
1.90% |
141.18 |
|
| £55-60K |
2.09% |
1.47% |
141.78 |
|
| £60-65K |
1.63% |
1.15% |
141.76 |
|
| £65-70K |
1.28% |
0.91% |
141.27 |
|
| £70-75K |
1.01% |
0.72% |
140.43 |
|
| £75-80K |
0.80% |
0.57% |
139.31 |
|
| £80-85K |
0.64% |
0.46% |
138.00 |
|
| £85-90K |
0.51% |
0.37% |
136.53 |
|
| £90-95K |
0.41% |
0.31% |
134.94 |
|
| £95-100K |
0.33% |
0.25% |
133.27 |
|
| £100K + |
1.62% |
1.34% |
120.46 |
|
|
|
|


|
1992-1997
|
1997-2001
|
|
|
|
| Con |
-12.51% |
| Lab |
6.76% |
| LD |
1.44% |
| SNP |
3.42% |
|
| Con |
-4.09% |
| Lab |
-6.46% |
| LD |
8.42% |
| SNP |
-0.23% |
|
|
|
John Lyons
Labour hold
|
| Con |
 |
6,635 |
15.99% |
| Lab |
 |
19,250 |
46.40% |
| LD |
 |
7,533 |
18.16% |
| SNP |
 |
6,675 |
16.09% |
| Oth |
 |
1,393 |
3.36% |
| Maj |
 |
11,717 |
28.24% |
| Turn |
|
41,486 |
66.14% |
|
|
|
John Lyons
Labour hold
|
| L |
John Lyons |
19,250 |
46.40% |
| LD |
Gordon Macdonald |
7,533 |
18.16% |
| C |
Murray Roxburgh |
6,635 |
15.99% |
| SNP |
Calum Smith |
6,675 |
16.09% |
| SSP |
Willie Telfer |
1,393 |
3.36% |
|
Candidates representing 5 parties stood for election to this seat.
|
|
|
Sam Galbraith
Labour
|
| Con |
|
9,986 |
20.09% |
| Lab |
|
26,278 |
52.86% |
| LD |
|
4,843 |
9.74% |
| SNP |
|
8,111 |
16.32% |
| Ref |
 |
339 |
0.68% |
| Oth |
|
155 |
0.31% |
| Maj |
|
16,292 |
32.77% |
| Turn |
|
49,712 |
79.07% |
|
|
|
|
Labour
|
| Con |
|
16,710 |
32.60% |
| Lab |
|
23,658 |
46.10% |
| LD |
|
4,252 |
8.30% |
| SNP |
|
6,621 |
12.90% |
| Oth |
|
85 |
0.20% |
| Maj |
|
6,948 |
13.50% |
| Turn |
|
51,326 |
80.85% |
|
|
|
|
|