|
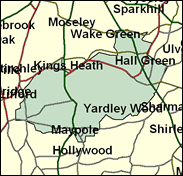
Birmingham, Hall Green
Labour hold

Hall Green was one of the two seats held by the Conservatives before they were wiped out in Birmingham in 1997, but it fell by a greater margin than Edgbaston, and it will take a swing of more than 10pc for Chris White to remove Steve McCabe. The Conservative candidates for the wards within this seat on Birmingham's southern edge (Billesley, Brandwood and the eponymous Hall Green) garnered narrowly more votes than their Labour counterparts in 1998 and 1999, but 15pc more in 2000, a good year for the Tories in the West Midlands. The chances are that the next general election will see a much closer result in this constituency.

Strongly Scots-accented former social worker Steve McCabe, who won this seat in 1997, is one of a score of migrant Scots occupying Labour seats in England. Born 1955, educated at Port Glasgow Senior Secondary School, Moray House College of Education, and Bradford University, he has done little to earn his self-description as a ‘socialist Blairite', though he has called on the RUC to cease being a ‘colonial police force'. His Tory challenger, 33 year-old Rover executive Chris White, works at Longbridge and may seek to hang that plant's problems round the government's neck.
 |
| Wealthy Achievers, Suburban Areas |
11.49% |
14.99% |
76.67 |
|
| Affluent Greys, Rural Communities |
0.00% |
2.13% |
0.00 |
|
| Prosperous Pensioners, Retirement Areas |
0.98% |
2.49% |
39.25 |
|
| Affluent Executives, Family Areas |
0.34% |
4.43% |
7.76 |
|
| Well-Off Workers, Family Areas |
3.31% |
7.27% |
45.56 |
|
| Affluent Urbanites, Town & City Areas |
0.28% |
2.56% |
10.83 |
|
| Prosperous Professionals, Metropolitan Areas |
0.00% |
2.04% |
0.00 |
|
| Better-Off Executives, Inner City Areas |
0.17% |
3.94% |
4.35 |
|
| Comfortable Middle Agers, Mature Home Owning Areas |
25.31% |
13.04% |
194.11 |
|
| Skilled Workers, Home Owning Areas |
10.27% |
12.70% |
80.84 |
|
| New Home Owners, Mature Communities |
8.53% |
8.14% |
104.80 |
|
| White Collar Workers, Better-Off Multi Ethnic Areas |
5.68% |
4.02% |
141.36 |
|
| Older People, Less Prosperous Areas |
4.46% |
3.19% |
140.10 |
|
| Council Estate Residents, Better-Off Homes |
25.10% |
11.31% |
221.90 |
|
| Council Estate Residents, High Unemployment |
2.81% |
3.06% |
91.73 |
|
| Council Estate Residents, Greatest Hardship |
0.74% |
2.52% |
29.48 |
|
| People in Multi-Ethnic, Low-Income Areas |
0.51% |
2.10% |
24.35 |
|
| Unclassified |
0.00% |
0.06% |
0.00 |
|
|
 |
 |
 |
| £0-5K |
11.31% |
9.41% |
120.16 |
|
| £5-10K |
18.13% |
16.63% |
109.02 |
|
| £10-15K |
17.37% |
16.58% |
104.76 |
|
| £15-20K |
13.87% |
13.58% |
102.12 |
|
| £20-25K |
10.36% |
10.39% |
99.69 |
|
| £25-30K |
7.55% |
7.77% |
97.12 |
|
| £30-35K |
5.47% |
5.79% |
94.38 |
|
| £35-40K |
3.97% |
4.33% |
91.54 |
|
| £40-45K |
2.90% |
3.27% |
88.67 |
|
| £45-50K |
2.13% |
2.48% |
85.83 |
|
| £50-55K |
1.58% |
1.90% |
83.06 |
|
| £55-60K |
1.19% |
1.47% |
80.40 |
|
| £60-65K |
0.90% |
1.15% |
77.86 |
|
| £65-70K |
0.68% |
0.91% |
75.44 |
|
| £70-75K |
0.53% |
0.72% |
73.15 |
|
| £75-80K |
0.41% |
0.57% |
70.99 |
|
| £80-85K |
0.32% |
0.46% |
68.95 |
|
| £85-90K |
0.25% |
0.37% |
67.04 |
|
| £90-95K |
0.20% |
0.31% |
65.23 |
|
| £95-100K |
0.16% |
0.25% |
63.53 |
|
| £100K + |
0.74% |
1.34% |
54.83 |
|
|
|

|


|
1992-1997
|
1997-2001
|
|
|
|
| Con |
-12.74% |
| Lab |
15.20% |
| LD |
-5.95% |
|
| Con |
1.10% |
| Lab |
1.06% |
| LD |
-0.80% |
|
|
 |
Steve McCabe
Labour hold
|
| Con |
 |
11,401 |
34.46% |
| Lab |
 |
18,049 |
54.56% |
| LD |
 |
2,926 |
8.84% |
| Oth |
 |
708 |
2.14% |
| Maj |
 |
6,648 |
20.09% |
| Turn |
 |
33,084 |
57.47% |
|
|
 |
Steve McCabe
Labour hold
|
| UK |
Peter Johnson |
708 |
2.14% |
| L |
Steve McCabe |
18,049 |
54.56% |
| LD |
Punjab Singh |
2,926 |
8.84% |
| C |
Chris White |
11,401 |
34.46% |
|
Candidates representing 4 parties stood for election to this seat.
|
|
 |
Stephen McCabe
Labour gain
|
| Con |
 |
13,952 |
33.36% |
| Lab |
 |
22,372 |
53.50% |
| LD |
 |
4,034 |
9.65% |
| Ref |
 |
1,461 |
3.49% |
| Oth |
|
0 |
0.00% |
| Maj |
 |
8,420 |
20.13% |
| Turn |
 |
41,819 |
71.16% |
|
|
 |
|
Conservative
|
| Con |
 |
21,649 |
46.10% |
| Lab |
 |
17,984 |
38.30% |
| LD |
 |
7,342 |
15.60% |
| Oth |
|
0 |
0.00% |
| Maj |
 |
3,665 |
7.80% |
| Turn |
 |
46,975 |
77.11% |
|
|
 |
|

|

