|
Streatham
Labour hold

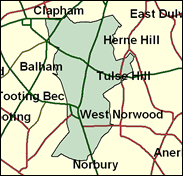
The seat named Streatham was Conservative even in 1945 and 1966 and all the way through to 1992, but it has changed in three dramatic ways since then. First, there were substantial boundary changes which have moved the northern edge of this southernmost constituency in Lambeth Borough to the mixed race and inner city neighbourhoods near the heart of Brixton in Tulse Hill ward; Railton Road, the "Front Line" of the riots of the early 1980s, is now in this seat, which overall is 28pc non-white. Over half the residents of the Brixton neighbourhood are white, contrary to popular belief, but this is the kind of resident which does not mind, even relishes, cultural diversity. Second there have been the regional London wing to Labour since their dark days, particularly in Lambeth, the borough of "Red Ted" Knight in the late 70s and early 80s. Finally, a 15pc swing, not untypical for London boosted Keith Hill's majority to over 18,000 in the national landslide year of 1997. It is one of the most spectacular transformations in the country.

Keith Hill, Minister for London and previously a union and Party apparatchik, won Streatham in 1992 as its first ever Labour MP. He spent 16 years as political officer with the NUR, two years in the Labour Party's international department, and eight years teaching politics at Leicester and Strathclyde Universities, during which time he was an expert in "segmented pluralism" in Belgium. Born 1943 and educated at City of Leicester Boys' Grammar School and Corpus Christi College Oxford, given ageism he was lucky to be made a Whip in 1998, assisted by a gregarious and youthful manner belying his 55 years. With the largest rictus in the business and with an effortlessly fluent high camp style at the dispatch box, he is one of the government's insufficiently sung heroes, notwithstanding his unintentionally ambiguous dubbing of motor cycling enthusiast Salford MP Hazel Blears as "Blears the Bike".
 |
| Wealthy Achievers, Suburban Areas |
0.86% |
14.99% |
5.77 |
|
| Affluent Greys, Rural Communities |
0.00% |
2.13% |
0.00 |
|
| Prosperous Pensioners, Retirement Areas |
0.00% |
2.49% |
0.00 |
|
| Affluent Executives, Family Areas |
0.00% |
4.43% |
0.00 |
|
| Well-Off Workers, Family Areas |
0.00% |
7.27% |
0.00 |
|
| Affluent Urbanites, Town & City Areas |
6.99% |
2.56% |
272.45 |
|
| Prosperous Professionals, Metropolitan Areas |
27.97% |
2.04% |
1,370.35 |
|
| Better-Off Executives, Inner City Areas |
23.90% |
3.94% |
605.95 |
|
| Comfortable Middle Agers, Mature Home Owning Areas |
0.00% |
13.04% |
0.00 |
|
| Skilled Workers, Home Owning Areas |
0.00% |
12.70% |
0.00 |
|
| New Home Owners, Mature Communities |
0.00% |
8.14% |
0.00 |
|
| White Collar Workers, Better-Off Multi Ethnic Areas |
14.17% |
4.02% |
352.40 |
|
| Older People, Less Prosperous Areas |
0.00% |
3.19% |
0.00 |
|
| Council Estate Residents, Better-Off Homes |
1.15% |
11.31% |
10.15 |
|
| Council Estate Residents, High Unemployment |
9.66% |
3.06% |
315.55 |
|
| Council Estate Residents, Greatest Hardship |
0.00% |
2.52% |
0.00 |
|
| People in Multi-Ethnic, Low-Income Areas |
15.30% |
2.10% |
728.47 |
|
| Unclassified |
0.00% |
0.06% |
0.00 |
|
|
 |
 |
 |
| £0-5K |
5.51% |
9.41% |
58.54 |
|
| £5-10K |
10.84% |
16.63% |
65.18 |
|
| £10-15K |
12.64% |
16.58% |
76.22 |
|
| £15-20K |
12.01% |
13.58% |
88.42 |
|
| £20-25K |
10.46% |
10.39% |
100.64 |
|
| £25-30K |
8.74% |
7.77% |
112.39 |
|
| £30-35K |
7.15% |
5.79% |
123.48 |
|
| £35-40K |
5.80% |
4.33% |
133.84 |
|
| £40-45K |
4.68% |
3.27% |
143.47 |
|
| £45-50K |
3.78% |
2.48% |
152.41 |
|
| £50-55K |
3.06% |
1.90% |
160.70 |
|
| £55-60K |
2.48% |
1.47% |
168.41 |
|
| £60-65K |
2.02% |
1.15% |
175.60 |
|
| £65-70K |
1.65% |
0.91% |
182.30 |
|
| £70-75K |
1.36% |
0.72% |
188.58 |
|
| £75-80K |
1.12% |
0.57% |
194.48 |
|
| £80-85K |
0.93% |
0.46% |
200.03 |
|
| £85-90K |
0.77% |
0.37% |
205.26 |
|
| £90-95K |
0.64% |
0.31% |
210.22 |
|
| £95-100K |
0.54% |
0.25% |
214.91 |
|
| £100K + |
3.24% |
1.34% |
240.82 |
|
|
|

|


|
1992-1997
|
1997-2001
|
|
|
|
| Con |
-16.66% |
| Lab |
13.38% |
| LD |
3.55% |
|
| Con |
-3.80% |
| Lab |
-5.91% |
| LD |
4.75% |
|
|
 |
Keith Hill
Labour hold
|
| Con |
 |
6,639 |
17.94% |
| Lab |
 |
21,041 |
56.87% |
| LD |
 |
6,771 |
18.30% |
| Oth |
 |
2,547 |
6.88% |
| Maj |
 |
14,270 |
38.57% |
| Turn |
 |
36,998 |
48.67% |
|
|
 |
Keith Hill
Labour hold
|
| L |
Keith Hill |
21,041 |
56.87% |
| C |
Stephen Hocking |
6,639 |
17.94% |
| LD |
Roger O'Brien |
6,771 |
18.30% |
| G |
Mohammed Sajid |
1,641 |
4.44% |
| SA |
Greg Tucker |
906 |
2.45% |
|
Candidates representing 5 parties stood for election to this seat.
|
|
 |
Keith Hill
Labour
|
| Con |
 |
9,758 |
21.74% |
| Lab |
 |
28,181 |
62.78% |
| LD |
 |
6,082 |
13.55% |
| Ref |
 |
864 |
1.92% |
| Oth |
|
0 |
0.00% |
| Maj |
 |
18,423 |
41.04% |
| Turn |
 |
44,885 |
60.24% |
|
|
 |
|
Labour
|
| Con |
 |
19,114 |
38.40% |
| Lab |
 |
24,585 |
49.40% |
| LD |
 |
4,966 |
10.00% |
| Oth |
 |
1,107 |
2.20% |
| Maj |
 |
5,471 |
11.00% |
| Turn |
 |
49,772 |
70.09% |
|
|
 |
|

|

