|
Stroud
Labour hold

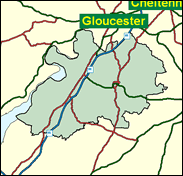
One of Labour's unlikely gains in 1997, not so much because it is a rural seat - there is in fact a surprising amount of industry around Chalford, Dursley, Cam and the Golden Valley - but because it required nearly all of the ten per cent plus swing achieved by David Drew in 1997, and would fall on a movement back to the right of only 2.5 per cent. Local and Euro evidence in the last four years suggests that this is probable rather than merely possible. However, this would not be a disaster for Mr Blair and his Third Way project. Stroud was never an essential element in New Labour's plan to regain office after the 18 year gap, but rather a tasty bonus.

David Drew, residually Gloucestershire-burred and elected in 1997, was a local councillor for eight years and a teacher or lecturer for 21. Born in 1952 and educated at Kingsfield School, Kingswood, Bristol and at Nottingham and Birmingham Universities and at Bristol Polytechnic, he has campaigned for a Rural Affairs ministry as MP for a seat with both a vocal Countryside lobby and Green Party activity. Otherwise he either votes against or abstains on legalising homosexual sex at 16. The Conservatives seek to reverse their surprise 1997 defeat here with a northern (Northumberland-based) farmer, with an even more northern name, Neil Carmichael. Experienced as a (twice) Euro and (once) parliamentary candidate, he was born in 1961, attended St. Peter's School, York, and Nottingham and Newcastle Universities, and has diversified latterly into charitable day care provision for those with learning disabilities.
 |
| Wealthy Achievers, Suburban Areas |
32.80% |
14.99% |
218.79 |
|
| Affluent Greys, Rural Communities |
0.37% |
2.13% |
17.53 |
|
| Prosperous Pensioners, Retirement Areas |
0.95% |
2.49% |
38.35 |
|
| Affluent Executives, Family Areas |
7.00% |
4.43% |
158.11 |
|
| Well-Off Workers, Family Areas |
7.13% |
7.27% |
98.04 |
|
| Affluent Urbanites, Town & City Areas |
0.23% |
2.56% |
8.84 |
|
| Prosperous Professionals, Metropolitan Areas |
0.00% |
2.04% |
0.00 |
|
| Better-Off Executives, Inner City Areas |
0.29% |
3.94% |
7.29 |
|
| Comfortable Middle Agers, Mature Home Owning Areas |
20.48% |
13.04% |
157.05 |
|
| Skilled Workers, Home Owning Areas |
10.15% |
12.70% |
79.91 |
|
| New Home Owners, Mature Communities |
11.99% |
8.14% |
147.30 |
|
| White Collar Workers, Better-Off Multi Ethnic Areas |
1.95% |
4.02% |
48.42 |
|
| Older People, Less Prosperous Areas |
2.37% |
3.19% |
74.34 |
|
| Council Estate Residents, Better-Off Homes |
4.28% |
11.31% |
37.81 |
|
| Council Estate Residents, High Unemployment |
0.00% |
3.06% |
0.00 |
|
| Council Estate Residents, Greatest Hardship |
0.00% |
2.52% |
0.00 |
|
| People in Multi-Ethnic, Low-Income Areas |
0.00% |
2.10% |
0.00 |
|
| Unclassified |
0.01% |
0.06% |
20.46 |
|
|
 |
 |
 |
| £0-5K |
7.82% |
9.41% |
83.05 |
|
| £5-10K |
15.02% |
16.63% |
90.31 |
|
| £10-15K |
16.17% |
16.58% |
97.55 |
|
| £15-20K |
13.96% |
13.58% |
102.78 |
|
| £20-25K |
11.03% |
10.39% |
106.16 |
|
| £25-30K |
8.41% |
7.77% |
108.18 |
|
| £30-35K |
6.33% |
5.79% |
109.26 |
|
| £35-40K |
4.75% |
4.33% |
109.71 |
|
| £40-45K |
3.58% |
3.27% |
109.74 |
|
| £45-50K |
2.72% |
2.48% |
109.50 |
|
| £50-55K |
2.08% |
1.90% |
109.07 |
|
| £55-60K |
1.60% |
1.47% |
108.52 |
|
| £60-65K |
1.24% |
1.15% |
107.91 |
|
| £65-70K |
0.97% |
0.91% |
107.26 |
|
| £70-75K |
0.77% |
0.72% |
106.60 |
|
| £75-80K |
0.61% |
0.57% |
105.93 |
|
| £80-85K |
0.49% |
0.46% |
105.28 |
|
| £85-90K |
0.39% |
0.37% |
104.64 |
|
| £90-95K |
0.32% |
0.31% |
104.03 |
|
| £95-100K |
0.26% |
0.25% |
103.44 |
|
| £100K + |
1.35% |
1.34% |
100.46 |
|
|
|

|


|
1992-1997
|
1997-2001
|
|
|
|
| Con |
-8.89% |
| Lab |
12.57% |
| LD |
-6.36% |
|
| Con |
0.11% |
| Lab |
4.58% |
| LD |
-4.30% |
|
|
 |
David Drew
Labour hold
|
| Con |
 |
20,646 |
37.42% |
| Lab |
 |
25,685 |
46.55% |
| LD |
 |
6,036 |
10.94% |
| Oth |
 |
2,808 |
5.09% |
| Maj |
 |
5,039 |
9.13% |
| Turn |
 |
55,175 |
69.95% |
|
|
 |
David Drew
Labour hold
|
| LD |
Janice Beasley |
6,036 |
10.94% |
| UK |
Adrian Blake |
895 |
1.62% |
| C |
Neil Carmichael |
20,646 |
37.42% |
| G |
Kevin Cranston |
1,913 |
3.47% |
| L |
David Drew |
25,685 |
46.55% |
|
Candidates representing 5 parties stood for election to this seat.
|
|
 |
David Drew
Labour gain
|
| Con |
 |
23,260 |
37.31% |
| Lab |
 |
26,170 |
41.97% |
| LD |
 |
9,502 |
15.24% |
| Ref |
|
0 |
0.00% |
| Oth |
 |
3,415 |
5.48% |
| Maj |
 |
2,910 |
4.67% |
| Turn |
 |
62,347 |
80.45% |
|
|
 |
|
Conservative
|
| Con |
 |
29,032 |
46.20% |
| Lab |
 |
18,451 |
29.40% |
| LD |
 |
13,582 |
21.60% |
| Oth |
 |
1,718 |
2.70% |
| Maj |
 |
10,581 |
16.90% |
| Turn |
 |
62,783 |
83.43% |
|
|
 |
|

|

