|
Suffolk Central & Ipswich North
Conservative hold

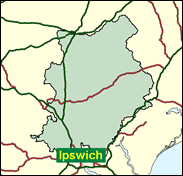
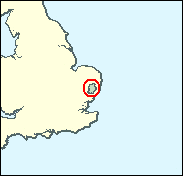
This is a clumsily named but well described seat. Ipswich is a little large for a single seat of its own, so it loses four northern wards, two basically Labour (the council estates of Whitton and White House) and two Conservative residential areas (Broom Hill and Castle Hill) on its northern periphery; these are placed together with a ragbag of central Suffolk left over from the creation of the Coastal, South, West and Bury St Edmunds divisions. This includes diverse territory such as the sprawling suburb of Kesgrave to the east of Ipswich, and Framlingham with its fine castle and public school, and a swathe of fertile and gently rolling farmland, golden with corn and dark green with oak trees in the summer. Like all the other mainly rural Suffolk seats, it was held by the Conservatives over Labour in 1997, but not by a large margin.

Michael Lord, a bald and pleasant arboriculturalist of Thatcherite hue, and first elected on the high rightwing tide of 1983, was the 16th most rebellious Tory MP on the Maastricht Bill. Born 1938 and educated at William Hulme's Grammar School, Manchester, and Christ's College, Cambridge, he worked previously in his own tree-selling business, and has fallen silent since 1997 as one of the Speaker's three deputies, in his case as Deputy Chairman of Ways & Means.
 |
| Wealthy Achievers, Suburban Areas |
25.77% |
14.99% |
171.88 |
|
| Affluent Greys, Rural Communities |
8.99% |
2.13% |
422.94 |
|
| Prosperous Pensioners, Retirement Areas |
1.17% |
2.49% |
46.94 |
|
| Affluent Executives, Family Areas |
1.50% |
4.43% |
33.95 |
|
| Well-Off Workers, Family Areas |
6.58% |
7.27% |
90.44 |
|
| Affluent Urbanites, Town & City Areas |
0.83% |
2.56% |
32.41 |
|
| Prosperous Professionals, Metropolitan Areas |
0.00% |
2.04% |
0.00 |
|
| Better-Off Executives, Inner City Areas |
0.00% |
3.94% |
0.00 |
|
| Comfortable Middle Agers, Mature Home Owning Areas |
30.88% |
13.04% |
236.81 |
|
| Skilled Workers, Home Owning Areas |
10.00% |
12.70% |
78.72 |
|
| New Home Owners, Mature Communities |
7.44% |
8.14% |
91.37 |
|
| White Collar Workers, Better-Off Multi Ethnic Areas |
0.54% |
4.02% |
13.53 |
|
| Older People, Less Prosperous Areas |
2.14% |
3.19% |
67.27 |
|
| Council Estate Residents, Better-Off Homes |
2.78% |
11.31% |
24.57 |
|
| Council Estate Residents, High Unemployment |
0.21% |
3.06% |
6.99 |
|
| Council Estate Residents, Greatest Hardship |
1.16% |
2.52% |
45.98 |
|
| People in Multi-Ethnic, Low-Income Areas |
0.00% |
2.10% |
0.00 |
|
| Unclassified |
0.00% |
0.06% |
0.00 |
|
|
 |
 |
 |
| £0-5K |
8.34% |
9.41% |
88.62 |
|
| £5-10K |
16.18% |
16.63% |
97.26 |
|
| £10-15K |
16.91% |
16.58% |
102.00 |
|
| £15-20K |
14.17% |
13.58% |
104.35 |
|
| £20-25K |
10.93% |
10.39% |
105.15 |
|
| £25-30K |
8.16% |
7.77% |
104.99 |
|
| £30-35K |
6.04% |
5.79% |
104.24 |
|
| £35-40K |
4.47% |
4.33% |
103.14 |
|
| £40-45K |
3.33% |
3.27% |
101.84 |
|
| £45-50K |
2.49% |
2.48% |
100.44 |
|
| £50-55K |
1.88% |
1.90% |
98.98 |
|
| £55-60K |
1.44% |
1.47% |
97.51 |
|
| £60-65K |
1.11% |
1.15% |
96.06 |
|
| £65-70K |
0.86% |
0.91% |
94.63 |
|
| £70-75K |
0.67% |
0.72% |
93.24 |
|
| £75-80K |
0.53% |
0.57% |
91.90 |
|
| £80-85K |
0.42% |
0.46% |
90.60 |
|
| £85-90K |
0.33% |
0.37% |
89.35 |
|
| £90-95K |
0.27% |
0.31% |
88.14 |
|
| £95-100K |
0.22% |
0.25% |
86.98 |
|
| £100K + |
1.08% |
1.34% |
80.36 |
|
|
|

|


|
1992-1997
|
1997-2001
|
|
|
|
| Con |
-13.22% |
| Lab |
15.18% |
| LD |
-1.29% |
|
| Con |
1.84% |
| Lab |
1.17% |
| LD |
-4.49% |
|
|
 |
Michael Lord
Conservative hold
|
| Con |
 |
20,924 |
44.42% |
| Lab |
 |
17,455 |
37.06% |
| LD |
 |
7,593 |
16.12% |
| Oth |
 |
1,132 |
2.40% |
| Maj |
 |
3,469 |
7.36% |
| Turn |
 |
47,104 |
63.48% |
|
|
 |
Michael Lord
Conservative hold
|
| LD |
Ann Elvin |
7,593 |
16.12% |
| L |
Carole Jones |
17,455 |
37.06% |
| C |
Michael Lord |
20,924 |
44.42% |
| UK |
Jonathan Wright |
1,132 |
2.40% |
|
Candidates representing 4 parties stood for election to this seat.
|
|
 |
Michael Lord
Conservative
|
| Con |
 |
22,493 |
42.58% |
| Lab |
 |
18,955 |
35.88% |
| LD |
 |
10,886 |
20.61% |
| Ref |
|
0 |
0.00% |
| Oth |
 |
489 |
0.93% |
| Maj |
 |
3,538 |
6.70% |
| Turn |
 |
52,823 |
75.22% |
|
|
 |
|
Conservative
|
| Con |
 |
29,610 |
55.80% |
| Lab |
 |
10,980 |
20.70% |
| LD |
 |
11,604 |
21.90% |
| Oth |
 |
850 |
1.60% |
| Maj |
 |
18,006 |
33.90% |
| Turn |
 |
53,044 |
80.14% |
|
|
 |
|

|

