|
Suffolk Coastal
Conservative hold

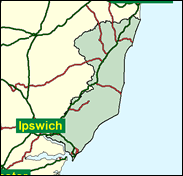
John Gummer's constituency is, as its name implies, a strip which covers almost the whole of Suffolk's sea frontage, apart from the area around Lowestoft, which is in Waveney. Therefore it passes through the individual and charming small seaside town of Southwold; Aldeburgh famed for its music festival at The Maltings; Leiston and the Sizewell nuclear power station; Woodbridge, a lively town a few miles up the river Deben; and Felixstowe, the largest, a bustling private and ferry port. There are Labour voters in most of these, and they pressed Gummer fairly close in 1997, but it is hard to see another surprise coastal gain being pulled off in 2001.

John Gummer was first elected at Lewisham West in 1970, sporting at the time one of the rare Tory beards. Beaten in 1974 he returned clean-shaven in 1979 as MP for Eye - a seat since abolished and resprayed as 'Suffolk Coastal.' Slight, high-pitched and prissy, it was said of him, allegedly by John Major, that he "would be considered one of the best politicians of his generation if only he were one stone heavier, one foot taller, and his voice one octave lower." Tackling all his jobs - latterly in Cabinet as Minister of Agriculture, then Environment Secretary - with "well-scrubbed enthusiasm" (The Independent), and with precisely articulated speech, he is churchy, as the son of a Baptist-turned-C of E-Canon, and as a bolter to Rome over women priests, but will be better remembered for force-feeding his daughter Cordelia a burger in order to show how safe beef was. Born 1939 and educated at King's School Rochester and Selwyn College, Cambridge, where he met and networked with the Tory Cambridge Mafia of Clarke, Brittan, Lamont et al, he worked in publishing and embarked on a political career inevitably stamped by the Europhilia of his origins in the Heath years. But it's hard to believe he's 60.
 |
| Wealthy Achievers, Suburban Areas |
15.89% |
14.99% |
105.98 |
|
| Affluent Greys, Rural Communities |
9.51% |
2.13% |
447.08 |
|
| Prosperous Pensioners, Retirement Areas |
9.61% |
2.49% |
386.67 |
|
| Affluent Executives, Family Areas |
7.52% |
4.43% |
169.86 |
|
| Well-Off Workers, Family Areas |
7.66% |
7.27% |
105.27 |
|
| Affluent Urbanites, Town & City Areas |
0.91% |
2.56% |
35.64 |
|
| Prosperous Professionals, Metropolitan Areas |
0.00% |
2.04% |
0.00 |
|
| Better-Off Executives, Inner City Areas |
0.97% |
3.94% |
24.69 |
|
| Comfortable Middle Agers, Mature Home Owning Areas |
22.83% |
13.04% |
175.12 |
|
| Skilled Workers, Home Owning Areas |
8.04% |
12.70% |
63.31 |
|
| New Home Owners, Mature Communities |
13.25% |
8.14% |
162.77 |
|
| White Collar Workers, Better-Off Multi Ethnic Areas |
1.07% |
4.02% |
26.72 |
|
| Older People, Less Prosperous Areas |
2.01% |
3.19% |
63.08 |
|
| Council Estate Residents, Better-Off Homes |
0.65% |
11.31% |
5.72 |
|
| Council Estate Residents, High Unemployment |
0.07% |
3.06% |
2.20 |
|
| Council Estate Residents, Greatest Hardship |
0.00% |
2.52% |
0.00 |
|
| People in Multi-Ethnic, Low-Income Areas |
0.00% |
2.10% |
0.00 |
|
| Unclassified |
0.00% |
0.06% |
0.00 |
|
|
 |
|
|
| £0-5K |
9.10% |
9.41% |
96.72 |
|
| £5-10K |
17.16% |
16.63% |
103.15 |
|
| £10-15K |
17.47% |
16.58% |
105.38 |
|
| £15-20K |
14.32% |
13.58% |
105.43 |
|
| £20-25K |
10.83% |
10.39% |
104.19 |
|
| £25-30K |
7.94% |
7.77% |
102.19 |
|
| £30-35K |
5.78% |
5.79% |
99.74 |
|
| £35-40K |
4.20% |
4.33% |
97.05 |
|
| £40-45K |
3.08% |
3.27% |
94.27 |
|
| £45-50K |
2.27% |
2.48% |
91.48 |
|
| £50-55K |
1.69% |
1.90% |
88.74 |
|
| £55-60K |
1.27% |
1.47% |
86.09 |
|
| £60-65K |
0.96% |
1.15% |
83.55 |
|
| £65-70K |
0.74% |
0.91% |
81.12 |
|
| £70-75K |
0.57% |
0.72% |
78.82 |
|
| £75-80K |
0.44% |
0.57% |
76.64 |
|
| £80-85K |
0.34% |
0.46% |
74.57 |
|
| £85-90K |
0.27% |
0.37% |
72.63 |
|
| £90-95K |
0.22% |
0.31% |
70.79 |
|
| £95-100K |
0.17% |
0.25% |
69.05 |
|
| £100K + |
0.81% |
1.34% |
60.01 |
|
|
|
|


|
1992-1997
|
1997-2001
|
|
|
|
| Con |
-13.83% |
| Lab |
9.48% |
| LD |
-1.30% |
|
| Con |
4.77% |
| Lab |
1.98% |
| LD |
-3.16% |
|
|
|
John Gummer
Conservative hold
|
| Con |
 |
21,847 |
43.34% |
| Lab |
 |
17,521 |
34.76% |
| LD |
 |
9,192 |
18.24% |
| Oth |
 |
1,847 |
3.66% |
| Maj |
 |
4,326 |
8.58% |
| Turn |
|
50,407 |
66.36% |
|
|
|
John Gummer
Conservative hold
|
| UK |
Michael Burn |
1,847 |
3.66% |
| L |
Nigel Gardner |
17,521 |
34.76% |
| C |
John Gummer |
21,847 |
43.34% |
| LD |
Tony Schur |
9,192 |
18.24% |
|
Candidates representing 4 parties stood for election to this seat.
|
|
|
John Gummer
Conservative
|
| Con |
|
21,696 |
38.57% |
| Lab |
|
18,442 |
32.78% |
| LD |
|
12,036 |
21.40% |
| Ref |
 |
3,416 |
6.07% |
| Oth |
|
666 |
1.18% |
| Maj |
|
3,254 |
5.78% |
| Turn |
|
56,256 |
75.80% |
|
|
|
|
Conservative
|
| Con |
|
30,030 |
52.40% |
| Lab |
|
13,325 |
23.30% |
| LD |
|
13,008 |
22.70% |
| Oth |
|
921 |
1.60% |
| Maj |
|
16,705 |
29.20% |
| Turn |
|
57,284 |
81.76% |
|
|
|
|
|