|
Suffolk South
Conservative hold

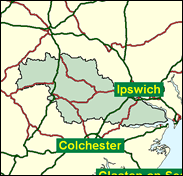
Tim Yeo has the largest Conservative majority in Suffolk, which is not saying much as it is only 4,175; but this could only ever be close in a massive Labour landslide. There are some Labour votes in Sudbury, which has been the recipient of some London overspill since the war, and its satellite Great Cornard, but a glance at the picture-book (and film set) towns of Lavenham and Long Melford, or Constable country by the Stour, with its colour-washed and thatched cottages suggst the peaceable heart of England, with much to conserve and/or escape to. This sounds fairly deeply Conservative barring further catastrophe.

Tim Yeo, Shadow Agriculture Minister, has been MP here since the seat's creation in 1983 when he replaced the sitting MP Keith Stainton. Born 1945, a doctor's son, and educated at Charterhouse and Emmanuel College, Cambridge, he worked for Peter Walker before running the Spastics Society and rose as an MP under the patronage of Douglas Hurd, whom he backed for leader in 1990. Since then he has redefined One Nation Toryism as not "excessively pro-European or leftwing" and trimmed in the direction of William Hague's rightwing Euroscepticism, backing him rather than Clarke in 1997. A pink-faced, plummy-voiced charmer, he is perhaps best known as the first of John Major's Back-to-Basics casualties, exposed in 1994 for fathering two illegitimate children, for which he was forced to resign as an Environment Minister, fend off a deselection threat, and manage - luckily - to retain his seat in the electoral rout of 1997. His family celebrated his 50th birthday with a banner declaiming 'fifty but frisky;' whilst Simon Hoggart (The Guardian) calculated that "the average adult British woman is four times more likely to have a love child by Tory Agriculture Spokesman, Tim Yeo, than to contract CJD through beef on the bone".
 |
| Wealthy Achievers, Suburban Areas |
31.54% |
14.99% |
210.34 |
|
| Affluent Greys, Rural Communities |
2.32% |
2.13% |
109.24 |
|
| Prosperous Pensioners, Retirement Areas |
1.95% |
2.49% |
78.23 |
|
| Affluent Executives, Family Areas |
9.20% |
4.43% |
207.92 |
|
| Well-Off Workers, Family Areas |
7.16% |
7.27% |
98.39 |
|
| Affluent Urbanites, Town & City Areas |
0.64% |
2.56% |
25.11 |
|
| Prosperous Professionals, Metropolitan Areas |
0.00% |
2.04% |
0.00 |
|
| Better-Off Executives, Inner City Areas |
0.14% |
3.94% |
3.66 |
|
| Comfortable Middle Agers, Mature Home Owning Areas |
18.73% |
13.04% |
143.64 |
|
| Skilled Workers, Home Owning Areas |
6.69% |
12.70% |
52.68 |
|
| New Home Owners, Mature Communities |
9.09% |
8.14% |
111.59 |
|
| White Collar Workers, Better-Off Multi Ethnic Areas |
2.06% |
4.02% |
51.22 |
|
| Older People, Less Prosperous Areas |
3.67% |
3.19% |
115.09 |
|
| Council Estate Residents, Better-Off Homes |
5.93% |
11.31% |
52.42 |
|
| Council Estate Residents, High Unemployment |
0.00% |
3.06% |
0.00 |
|
| Council Estate Residents, Greatest Hardship |
0.89% |
2.52% |
35.21 |
|
| People in Multi-Ethnic, Low-Income Areas |
0.00% |
2.10% |
0.00 |
|
| Unclassified |
0.00% |
0.06% |
0.00 |
|
|
 |
 |
 |
| £0-5K |
8.40% |
9.41% |
89.19 |
|
| £5-10K |
15.42% |
16.63% |
92.72 |
|
| £10-15K |
16.14% |
16.58% |
97.37 |
|
| £15-20K |
13.74% |
13.58% |
101.17 |
|
| £20-25K |
10.80% |
10.39% |
103.94 |
|
| £25-30K |
8.22% |
7.77% |
105.79 |
|
| £30-35K |
6.19% |
5.79% |
106.92 |
|
| £35-40K |
4.66% |
4.33% |
107.49 |
|
| £40-45K |
3.51% |
3.27% |
107.64 |
|
| £45-50K |
2.67% |
2.48% |
107.48 |
|
| £50-55K |
2.04% |
1.90% |
107.12 |
|
| £55-60K |
1.57% |
1.47% |
106.60 |
|
| £60-65K |
1.22% |
1.15% |
105.99 |
|
| £65-70K |
0.95% |
0.91% |
105.32 |
|
| £70-75K |
0.75% |
0.72% |
104.62 |
|
| £75-80K |
0.60% |
0.57% |
103.91 |
|
| £80-85K |
0.48% |
0.46% |
103.20 |
|
| £85-90K |
0.38% |
0.37% |
102.50 |
|
| £90-95K |
0.31% |
0.31% |
101.81 |
|
| £95-100K |
0.25% |
0.25% |
101.15 |
|
| £100K + |
1.31% |
1.34% |
97.54 |
|
|
|

|


|
1992-1997
|
1997-2001
|
|
|
|
| Con |
-13.97% |
| Lab |
7.50% |
| LD |
1.50% |
|
| Con |
4.06% |
| Lab |
0.88% |
| LD |
-2.76% |
|
|
 |
Tim Yeo
Conservative hold
|
| Con |
 |
18,748 |
41.39% |
| Lab |
 |
13,667 |
30.17% |
| LD |
 |
11,296 |
24.94% |
| Oth |
 |
1,582 |
3.49% |
| Maj |
 |
5,081 |
11.22% |
| Turn |
 |
45,293 |
66.21% |
|
|
 |
Tim Yeo
Conservative hold
|
| UK |
Derek Allen |
1,582 |
3.49% |
| LD |
Tessa Munt |
11,296 |
24.94% |
| C |
Tim Yeo |
18,748 |
41.39% |
| L |
Marc Young |
13,667 |
30.17% |
|
Candidates representing 4 parties stood for election to this seat.
|
|
 |
Tim Yeo
Conservative
|
| Con |
 |
19,402 |
37.33% |
| Lab |
 |
15,227 |
29.30% |
| LD |
 |
14,395 |
27.70% |
| Ref |
 |
2,740 |
5.27% |
| Oth |
 |
211 |
0.41% |
| Maj |
 |
4,175 |
8.03% |
| Turn |
 |
51,975 |
77.20% |
|
|
 |
|
Conservative
|
| Con |
 |
27,036 |
51.30% |
| Lab |
 |
11,504 |
21.80% |
| LD |
 |
13,828 |
26.20% |
| Oth |
 |
319 |
0.60% |
| Maj |
 |
13,208 |
25.10% |
| Turn |
 |
52,687 |
80.58% |
|
|
 |
|

|

