|
Suffolk West
Conservative hold

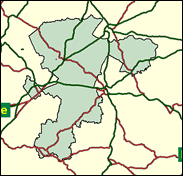
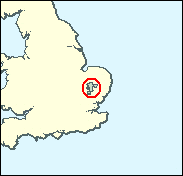
The four seats with the county name of Suffolk in their title were all won by the Conservatives with margins which would have seemed well nigh unbelievably small before the great New Labour advance of 1997, and it is not impossible that one at least might actually fall if Labour should increase their overall majority in the Commons to the round 200 in a putative 2001 Election. The most likely of these is Suffolk West, which includes the overspill town of Haverhill. Richard Spring won by only 1,867 votes in 1997. However, Labour cannot win any wards in Forest Heath District, nor many in the St Edmundsbury Borough section of Suffolk West, and are surely past their apogee here.

Richard Spring narrowly won here in 1997, having previously held Bury St Edmunds for five years. A former stockbroker, born 1946, in South Africa and educated at Rondesbosch School, Capetown, Capetown University and Magdalene College, Cambridge, he reached the front bench as a Culture Spokesman in 1998, switching to Foreign Affairs in 2000 despite tabloid exposure in 1995 for a three-in-a-bed-romp during which he allegedly made indiscreet remarks about the physical qualities of Norma Major and Michael Portillo, which cost him his job as PPS to Sir Patrick Mayhew. Self-dubbed a "centre-right-wing Tory", he has campaigned against drugs abuse, for tax breaks for his local racing industry, and the treble-counting of Labour government spending plans.
 |
| Wealthy Achievers, Suburban Areas |
17.75% |
14.99% |
118.39 |
|
| Affluent Greys, Rural Communities |
2.00% |
2.13% |
94.17 |
|
| Prosperous Pensioners, Retirement Areas |
4.04% |
2.49% |
162.48 |
|
| Affluent Executives, Family Areas |
12.53% |
4.43% |
283.26 |
|
| Well-Off Workers, Family Areas |
10.76% |
7.27% |
147.96 |
|
| Affluent Urbanites, Town & City Areas |
0.64% |
2.56% |
24.84 |
|
| Prosperous Professionals, Metropolitan Areas |
0.00% |
2.04% |
0.00 |
|
| Better-Off Executives, Inner City Areas |
0.95% |
3.94% |
24.02 |
|
| Comfortable Middle Agers, Mature Home Owning Areas |
18.61% |
13.04% |
142.70 |
|
| Skilled Workers, Home Owning Areas |
8.14% |
12.70% |
64.12 |
|
| New Home Owners, Mature Communities |
8.15% |
8.14% |
100.09 |
|
| White Collar Workers, Better-Off Multi Ethnic Areas |
1.53% |
4.02% |
38.02 |
|
| Older People, Less Prosperous Areas |
2.53% |
3.19% |
79.48 |
|
| Council Estate Residents, Better-Off Homes |
11.53% |
11.31% |
101.92 |
|
| Council Estate Residents, High Unemployment |
0.26% |
3.06% |
8.63 |
|
| Council Estate Residents, Greatest Hardship |
0.57% |
2.52% |
22.52 |
|
| People in Multi-Ethnic, Low-Income Areas |
0.00% |
2.10% |
0.00 |
|
| Unclassified |
0.01% |
0.06% |
8.21 |
|
|
 |
 |
 |
| £0-5K |
8.67% |
9.41% |
92.06 |
|
| £5-10K |
17.21% |
16.63% |
103.45 |
|
| £10-15K |
18.00% |
16.58% |
108.56 |
|
| £15-20K |
14.84% |
13.58% |
109.23 |
|
| £20-25K |
11.13% |
10.39% |
107.12 |
|
| £25-30K |
8.04% |
7.77% |
103.47 |
|
| £30-35K |
5.74% |
5.79% |
99.09 |
|
| £35-40K |
4.09% |
4.33% |
94.47 |
|
| £40-45K |
2.94% |
3.27% |
89.91 |
|
| £45-50K |
2.12% |
2.48% |
85.55 |
|
| £50-55K |
1.55% |
1.90% |
81.49 |
|
| £55-60K |
1.15% |
1.47% |
77.75 |
|
| £60-65K |
0.86% |
1.15% |
74.33 |
|
| £65-70K |
0.65% |
0.91% |
71.22 |
|
| £70-75K |
0.49% |
0.72% |
68.40 |
|
| £75-80K |
0.38% |
0.57% |
65.83 |
|
| £80-85K |
0.29% |
0.46% |
63.50 |
|
| £85-90K |
0.23% |
0.37% |
61.38 |
|
| £90-95K |
0.18% |
0.31% |
59.44 |
|
| £95-100K |
0.14% |
0.25% |
57.68 |
|
| £100K + |
0.67% |
1.34% |
49.73 |
|
|
|

|


|
1992-1997
|
1997-2001
|
|
|
|
| Con |
-12.89% |
| Lab |
13.11% |
| LD |
-7.26% |
|
| Con |
6.68% |
| Lab |
0.37% |
| LD |
-2.22% |
|
|
 |
Richard Spring
Conservative hold
|
| Con |
 |
20,201 |
47.59% |
| Lab |
 |
15,906 |
37.47% |
| LD |
 |
5,017 |
11.82% |
| Oth |
 |
1,321 |
3.11% |
| Maj |
 |
4,295 |
10.12% |
| Turn |
 |
42,445 |
59.60% |
|
|
 |
Richard Spring
Conservative hold
|
| UK |
Will Burrows |
1,321 |
3.11% |
| L |
Michael Jeffreys |
15,906 |
37.47% |
| LD |
Robin Martlew |
5,017 |
11.82% |
| C |
Richard Spring |
20,201 |
47.59% |
|
Candidates representing 4 parties stood for election to this seat.
|
|
 |
Richard Spring
Conservative
|
| Con |
 |
20,081 |
40.91% |
| Lab |
 |
18,214 |
37.11% |
| LD |
 |
6,892 |
14.04% |
| Ref |
 |
3,724 |
7.59% |
| Oth |
 |
171 |
0.35% |
| Maj |
 |
1,867 |
3.80% |
| Turn |
 |
49,082 |
71.51% |
|
|
 |
|
Conservative
|
| Con |
 |
28,455 |
53.80% |
| Lab |
 |
12,692 |
24.00% |
| LD |
 |
11,283 |
21.30% |
| Oth |
 |
419 |
0.80% |
| Maj |
 |
15,763 |
29.80% |
| Turn |
 |
52,849 |
78.79% |
|
|
 |
|

|

