|
Sunderland North
Labour hold

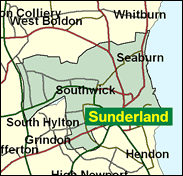
Wearside is one of the industrial bases of the North East, and if the traditionally local industries such as shipbuilding and coal have declined or gone, others have taken their place, such as Nissan cars, Rolls Royce, Corning (Pyrex), Nike, Dewhurst, Vaux, Grove-Coles and Philips. If this is some compensation - and recent threats to Nissan do not suggest security - Sunderland has still swung heavily to Labour since its marginal days in the 1950s, and although the Tories can still win some once good wards like Fulwell (which includes Seaburn) and St Peter's (which includes Roker) in a relatively good year like 2000, North is now massively safe for Labour, like its southern neighbour, even if it will have to hurry up its count to get the same attention on election night.

Bill Etherington, elected in 1992, is one of the dwindling band of former miners' union-sponsored MPs, by 1997 reduced to 12. Born 1941 and regionally-accented, he was educated at Monkwearmouth Grammar School and extra-murally at Durham University, and was a fitter at Dawson Colliery for 20 years. A lesser member of the hard-left Campaign Group he turns up for most of the rebellions against the government, notably lone parent benefit cuts, student grants, criminal justice, the prime minister's power to nominate life peers, incapacity benefit cuts, and jury trial curbs.
 |
| Wealthy Achievers, Suburban Areas |
3.40% |
14.99% |
22.70 |
|
| Affluent Greys, Rural Communities |
0.00% |
2.13% |
0.00 |
|
| Prosperous Pensioners, Retirement Areas |
0.00% |
2.49% |
0.00 |
|
| Affluent Executives, Family Areas |
0.92% |
4.43% |
20.90 |
|
| Well-Off Workers, Family Areas |
1.56% |
7.27% |
21.42 |
|
| Affluent Urbanites, Town & City Areas |
0.00% |
2.56% |
0.00 |
|
| Prosperous Professionals, Metropolitan Areas |
0.00% |
2.04% |
0.00 |
|
| Better-Off Executives, Inner City Areas |
2.72% |
3.94% |
69.01 |
|
| Comfortable Middle Agers, Mature Home Owning Areas |
10.78% |
13.04% |
82.70 |
|
| Skilled Workers, Home Owning Areas |
28.10% |
12.70% |
221.19 |
|
| New Home Owners, Mature Communities |
11.20% |
8.14% |
137.59 |
|
| White Collar Workers, Better-Off Multi Ethnic Areas |
1.40% |
4.02% |
34.79 |
|
| Older People, Less Prosperous Areas |
2.95% |
3.19% |
92.54 |
|
| Council Estate Residents, Better-Off Homes |
25.33% |
11.31% |
223.90 |
|
| Council Estate Residents, High Unemployment |
4.64% |
3.06% |
151.59 |
|
| Council Estate Residents, Greatest Hardship |
6.93% |
2.52% |
275.03 |
|
| People in Multi-Ethnic, Low-Income Areas |
0.00% |
2.10% |
0.00 |
|
| Unclassified |
0.07% |
0.06% |
107.91 |
|
|
 |
|
|
| £0-5K |
15.47% |
9.41% |
164.38 |
|
| £5-10K |
23.32% |
16.63% |
140.20 |
|
| £10-15K |
19.67% |
16.58% |
118.65 |
|
| £15-20K |
13.77% |
13.58% |
101.40 |
|
| £20-25K |
9.11% |
10.39% |
87.65 |
|
| £25-30K |
5.95% |
7.77% |
76.57 |
|
| £30-35K |
3.91% |
5.79% |
67.56 |
|
| £35-40K |
2.61% |
4.33% |
60.13 |
|
| £40-45K |
1.76% |
3.27% |
53.96 |
|
| £45-50K |
1.21% |
2.48% |
48.78 |
|
| £50-55K |
0.85% |
1.90% |
44.40 |
|
| £55-60K |
0.60% |
1.47% |
40.65 |
|
| £60-65K |
0.43% |
1.15% |
37.43 |
|
| £65-70K |
0.31% |
0.91% |
34.65 |
|
| £70-75K |
0.23% |
0.72% |
32.21 |
|
| £75-80K |
0.17% |
0.57% |
30.08 |
|
| £80-85K |
0.13% |
0.46% |
28.19 |
|
| £85-90K |
0.10% |
0.37% |
26.52 |
|
| £90-95K |
0.08% |
0.31% |
25.02 |
|
| £95-100K |
0.06% |
0.25% |
23.68 |
|
| £100K + |
0.24% |
1.34% |
18.02 |
|
|
|
|


|
1992-1997
|
1997-2001
|
|
|
|
| Con |
-11.13% |
| Lab |
8.62% |
| LD |
-0.50% |
|
| Con |
1.21% |
| Lab |
-5.56% |
| LD |
1.67% |
|
|
|
Bill Etherington
Labour hold
|
| Con |
 |
5,331 |
17.88% |
| Lab |
 |
18,685 |
62.66% |
| LD |
 |
3,599 |
12.07% |
| Oth |
 |
2,205 |
7.39% |
| Maj |
 |
13,354 |
44.78% |
| Turn |
|
29,820 |
49.01% |
|
|
|
Bill Etherington
Labour hold
|
| L |
Bill Etherington |
18,685 |
62.66% |
| BNP |
David Guyan |
687 |
2.30% |
| C |
Michael Harris |
5,331 |
17.88% |
| I |
Neil Herron |
1,518 |
5.09% |
| LD |
John Lennox |
3,599 |
12.07% |
|
Candidates representing 5 parties stood for election to this seat.
|
|
|
William Etherington
Labour
|
| Con |
|
6,370 |
16.67% |
| Lab |
|
26,067 |
68.22% |
| LD |
|
3,973 |
10.40% |
| Ref |
 |
1,394 |
3.65% |
| Oth |
|
409 |
1.07% |
| Maj |
|
19,697 |
51.55% |
| Turn |
|
38,213 |
59.05% |
|
|
|
|
Labour
|
| Con |
|
12,423 |
27.80% |
| Lab |
|
26,649 |
59.60% |
| LD |
|
4,895 |
10.90% |
| Oth |
|
747 |
1.70% |
| Maj |
|
14,226 |
31.80% |
| Turn |
|
44,714 |
68.37% |
|
|
|
|
|