|
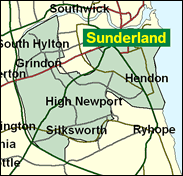
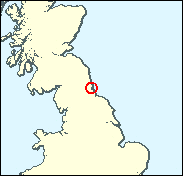
Sunderland South
Labour hold

This seat was easily the earliest to declare its result on the dramatic night of 1 May 1997, and is favourite to do so again next time. At least there won't be a recount, for Labour will hold the seat easily, and Chris Mullin will in all probability for the third time in a row find himself for a while the only MP declared elected to the new Parliament. However, all eyes will be focused on the size of the swing. At the present time, the Tories must be in mortal fear that there will scarcely be a movement back in their direction that can be measured, still less one that will carry them back into office.

Chris Mullin, elected here in 1987, is a Bennite factionalist transformed into a Blairite minister. As the only Campaign Group member to vote for Blair as leader in 1994 he was eventually rewarded in 1999 with a junior job as an Environment minister with responsibility for defending the partial privatisation of air traffic control in the face of repeated backbench revolts. He was rescued from this embarrassment in 2001 by consignment to the obscurity of a post at International Development. All this was some way on from his years as a campaigner against miscarriages of justice involving Irish Republicans, and his authorship of the radical activists' manual, 'How to Select and Reselect Your MP', which was devised to push 30 right-wing Labour MPs out of the party, in order to be replaced by people like him. Tall, lean and ascetic, and of donnish aspect, he was born of half-Irish parentage in 1947, and educated privately at St Joseph's (RC) College, Ipswich and at Hull University, where he read the Daily Telegraph.
 |
| Wealthy Achievers, Suburban Areas |
8.44% |
14.99% |
56.30 |
|
| Affluent Greys, Rural Communities |
0.00% |
2.13% |
0.00 |
|
| Prosperous Pensioners, Retirement Areas |
0.00% |
2.49% |
0.00 |
|
| Affluent Executives, Family Areas |
0.52% |
4.43% |
11.73 |
|
| Well-Off Workers, Family Areas |
7.19% |
7.27% |
98.88 |
|
| Affluent Urbanites, Town & City Areas |
5.61% |
2.56% |
218.68 |
|
| Prosperous Professionals, Metropolitan Areas |
0.01% |
2.04% |
0.63 |
|
| Better-Off Executives, Inner City Areas |
2.52% |
3.94% |
63.88 |
|
| Comfortable Middle Agers, Mature Home Owning Areas |
6.94% |
13.04% |
53.24 |
|
| Skilled Workers, Home Owning Areas |
12.95% |
12.70% |
101.98 |
|
| New Home Owners, Mature Communities |
13.92% |
8.14% |
170.91 |
|
| White Collar Workers, Better-Off Multi Ethnic Areas |
3.13% |
4.02% |
77.80 |
|
| Older People, Less Prosperous Areas |
5.59% |
3.19% |
175.62 |
|
| Council Estate Residents, Better-Off Homes |
20.70% |
11.31% |
183.01 |
|
| Council Estate Residents, High Unemployment |
3.75% |
3.06% |
122.35 |
|
| Council Estate Residents, Greatest Hardship |
8.31% |
2.52% |
329.86 |
|
| People in Multi-Ethnic, Low-Income Areas |
0.42% |
2.10% |
19.89 |
|
| Unclassified |
0.00% |
0.06% |
0.00 |
|
|
 |
 |
 |
| £0-5K |
15.76% |
9.41% |
167.45 |
|
| £5-10K |
22.86% |
16.63% |
137.44 |
|
| £10-15K |
18.79% |
16.58% |
113.33 |
|
| £15-20K |
13.11% |
13.58% |
96.49 |
|
| £20-25K |
8.80% |
10.39% |
84.71 |
|
| £25-30K |
5.92% |
7.77% |
76.19 |
|
| £30-35K |
4.04% |
5.79% |
69.79 |
|
| £35-40K |
2.81% |
4.33% |
64.82 |
|
| £40-45K |
1.99% |
3.27% |
60.82 |
|
| £45-50K |
1.43% |
2.48% |
57.53 |
|
| £50-55K |
1.04% |
1.90% |
54.76 |
|
| £55-60K |
0.77% |
1.47% |
52.37 |
|
| £60-65K |
0.58% |
1.15% |
50.29 |
|
| £65-70K |
0.44% |
0.91% |
48.44 |
|
| £70-75K |
0.34% |
0.72% |
46.79 |
|
| £75-80K |
0.26% |
0.57% |
45.29 |
|
| £80-85K |
0.20% |
0.46% |
43.93 |
|
| £85-90K |
0.16% |
0.37% |
42.67 |
|
| £90-95K |
0.13% |
0.31% |
41.51 |
|
| £95-100K |
0.10% |
0.25% |
40.43 |
|
| £100K + |
0.47% |
1.34% |
34.92 |
|
|
|

|


|
1992-1997
|
1997-2001
|
|
|
|
| Con |
-10.42% |
| Lab |
10.56% |
| LD |
-0.26% |
|
| Con |
1.23% |
| Lab |
-4.02% |
| LD |
0.28% |
|
|
 |
Chris Mullin
Labour hold
|
| Con |
 |
6,254 |
20.10% |
| Lab |
 |
19,921 |
64.04% |
| LD |
 |
3,675 |
11.81% |
| Oth |
 |
1,257 |
4.04% |
| Maj |
 |
13,667 |
43.94% |
| Turn |
 |
31,107 |
48.17% |
|
|
 |
Chris Mullin
Labour hold
|
| C |
Jim Boyd |
6,254 |
20.10% |
| BNP |
Joseph Dobbie |
576 |
1.85% |
| LD |
Mark Greenfield |
3,675 |
11.81% |
| UK |
Joseph Moore |
470 |
1.51% |
| L |
Chris Mullin |
19,921 |
64.04% |
| ML |
Rosalyn Warner |
211 |
0.68% |
|
Candidates representing 6 parties stood for election to this seat.
|
|
 |
Chris Mullin
Labour
|
| Con |
 |
7,536 |
18.88% |
| Lab |
 |
27,174 |
68.06% |
| LD |
 |
4,606 |
11.54% |
| Ref |
|
0 |
0.00% |
| Oth |
 |
609 |
1.53% |
| Maj |
 |
19,638 |
49.19% |
| Turn |
 |
39,925 |
58.77% |
|
|
 |
|
Labour
|
| Con |
 |
14,706 |
29.30% |
| Lab |
 |
28,829 |
57.50% |
| LD |
 |
5,933 |
11.80% |
| Oth |
 |
690 |
1.40% |
| Maj |
 |
14,123 |
28.20% |
| Turn |
 |
50,158 |
69.65% |
|
|
 |
|

|

